Texture Analysis to Measure the Effects of Enzyme Addition on the Staling of Artisanal Bread
The below passage is an excerpt of an article authored by Stable Micro Systems (SMS). For more information, visit SMS’ website.
Texture Analysis techniques
Chemical tests such as measuring water activity, alkaline water retention capacity, and the amount of soluble starch all can assist in assessing staling. However, the physical properties are the ones felt directly by the consumer, and these properties must be monitored when developing new formulations. Texture Analysis can be used to test bread properties at every step from dough to loaf.
Dough
The main properties of the dough, tailored through enzymes, are softness, stickiness, extensibility.
When baking, measuring dough and gluten extensibility are important in pre-determining the rise qualities and structure of the finished product. Stable Micro Systems offers two options to measure dough extensibility, used in academic environments and bakeries.
The Dobrascycyk-Roberts Dough Inflation System reproduces conditions similar to the proofing and baking process around a slowly expanding gas cell. The device uses a piston driven by a Texture Analyzer, which inflates a sheet of dough by volume displacement of air. Pressure is measured using a pressure transducer, and the volume of the inflating dough sheet is calculated from piston displacement.
The rheological properties of the dough (stress, strain, and viscosity) are then calculated from pressure, volume, and time. This procedure requires minimum handling of the dough when preparing samples. Typical results include baking strength, tenacity, extensibility, and elasticity.
The Kieffer Dough and Gluten Extensibility Rig effectively and accurately determines dough and gluten extensibility. The process only requires small samples (approx 10g flour or 1-2g gluten), which is especially useful for wheat breeders to gain information on rheological qualities during early development of hybrids.
Parallel tests of dough and gluten can reveal characteristics arising from homogenization, long relaxation times, or from adding oxidants, salts, emulsifiers, or enzymes. This rig measures maximum force (resistance to extension) and distance to break (extensibility).
The Warburtons Dough Stickiness System measures dough stickiness and firmness. Dough samples of 500g or 1Kg can be placed into a testing box quickly and with minimum exposure of the cut surface to air. The dough is slightly compressed via a retaining plate placed on top, and a narrow blade is driven through the plate to a defined distance.
This action measures force, obtaining the compression peak and compression area of the dough, which indicates its consistency (firmness/softness). As the blade is withdrawn upwards, Exponent software calculates the adhesion peak and adhesion area. Stickier dough will have a higher peak and/or larger adhesion area. This rig, as it minimizes the dough’s exposure to atmospheric variables, enables a more realistic assessment of dough stickiness than traditional open techniques.
Crust A fresh loaf of bread has a crust that is much crispier than the interior, but this property often degrades as the bread stales. Test your bread using a cylindrical penetration probe. A crispier crust will show high force peaks followed by a drop once the probe reaches the interior, while a loaf that has simply gone stale and hard will show a monotonous high resistance to the probe. Peak Count and Linear Distance will provide a good indication of crispness.
An Acoustic Envelope Detector will give an even more precise picture of the state of the bread, allowing quantitative measurement of the sound pressure level produced during crust penetration (this corresponds to the sounds heard when a consumer cuts or bites through the crust).
Crumb Exponent Software includes the Bread Resilience method, which measures elasticity and firmess, key properties in bread crumb staling. A radiused 36mm cylinder probe tests two bread slices stacked together, mimicking a manual test from the line operators at a large industrial bakery. The manual test involved squashing two stacked slices of bread by approximately 60% for 2 seconds. After approximately more 15 seconds, the percent of recovery was assessed visually, giving the factory a definition of ‘resilience.’ This method, unfortunately, is very subjective, with a wide range of variability. The Bread Resilience method provides a controlled version of this manual test, giving an objective resilience result.
The first part of the test is in accordance with the AACC standard firmness method – force to 25% strain. The percentage ratio of original height to post-test height shows resilience, the tendency of a sample to recover.
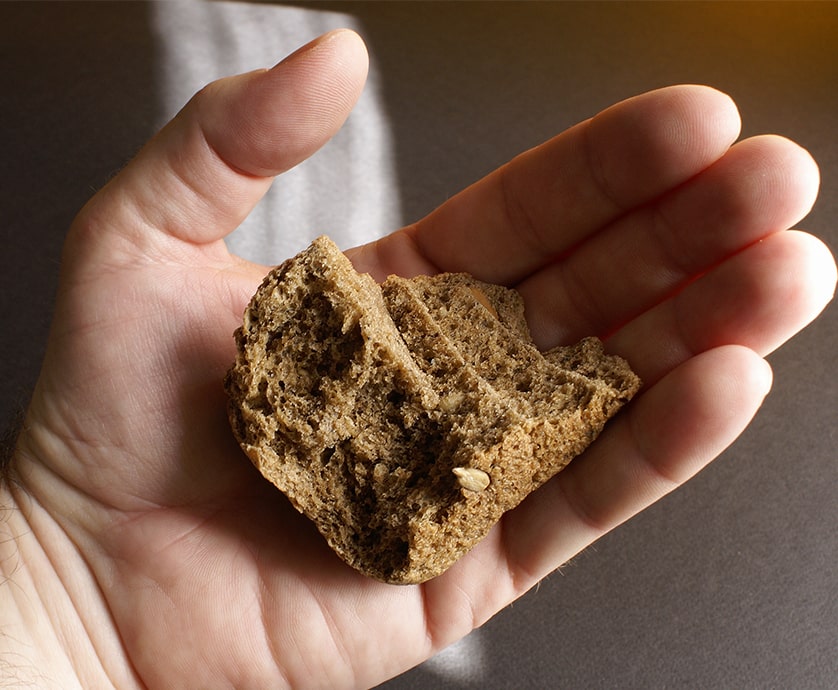
In this test, fresh bread shows an prompt return to its initial state after release, whereas stale bread deforms upon stress application, showing cracks and crumbles whic prevent the bread from springing back. Even though these cracks might be microscopic, bread resilience testing will show irreversible damage.
For objective measurements of staling, firmness and resilience tests should be performed during the storage period, and measuring should take place away from the crust to avoid dry edge effects. A radiused probe such as the P/36R is recommended to prevent cutting at the edges.
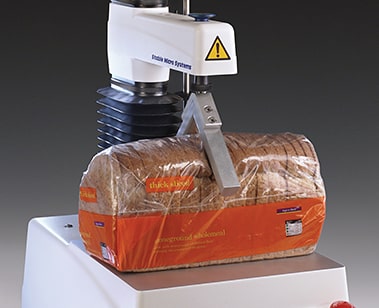
The SMS/Miller-Hoseney Toughness Rig offers another option to measure bread firmness. Developed in conjunction with Professor Hoseney and Dr. Miller of the Kansas State University, this rig is used to determine the firmness and toughness of bread and other sliceable products. The rig is made up of two adjustable angled base plates (which attach to the texture analyzer) and a support frame holding a stainless steel cutting wire, which connects directly to the loadcell. The force to cut through the sample is measured. This provides a test which imitates the way a customer slices their loaf.
Loaf When testing loaf freshness, many customers use the ‘squeeze test’, creating a ‘V’ shape with the hand and squashing it between the thumb and fingers. Increased firmness indicates staleness. The Bread V Squeeze Rig gives a good indication fo freshness by testing the softness and springiness of both packaged and unpackaged loaves.
Imitating the customer’s squeeze process, this rig allows repeatable, scientific analysis of the freshness and appeal of bread. It consists of ‘V’ shaped ‘fingers’, which are lowered onto the loaf, and the force required to compress the bread is measured – the lower the force and higher the value of springiness, the fresher the loaf. This non-destructive test is both simple and fast, as the loaf requires no preparation and can even be analyzed within the packaging.
The volume of a loaf is key in whether it’s likely to stale quickly. This property can be measured rapidly and accurately using the Volscan Profiler, a benchtop laser-based scanner that measures the volume, density, and dimensional profiles of solid products. This non-contact technique offers considerable advantages over contact and displacement techniques that can only measure volume.
The Volscan’s rapid 3-d digitization of products enables automatic calculations for several dimensional parameters, which may then be used immediately or saved for future retrieval. This enables manufacturers to have a precise and rapid method to measure bread’s volume, density, and dimensions, helping them control and monitor their manufacturing process.
During a test, the bread loaf is speared at each end. The operator enters parameters such as sample ID, name, date, and any bakery-specific parameters for each testing batch into the software. The product is then weighed and scanned with an eye-safe laser device, which measures the contours of the product at specific selectable intervals whilst it rotates.
Each interval consists of 400 data points, providing a detailed profile of the product. The time frame to run this test ranges from a few seconds to a few minutes depending upon the chosen interval (0.05mm to 50mm) and the preferred precision, while temperature of the testing chamber is measured automatically.
Thanks to the laser scanning the samples in a linear manner, the sample can be analyzed in ‘slices.’ This means that every increment possesses data such as circumference, average radius and minimal enclosing circle, providing a more detailed dimensional analysis than any other similar measuring instrument.
As biochemistry and enzyme technology advances, as well as interest in enzyme applications, we will continue to see more enzyme products reaching the market. There will also be an increase in understanding of the mechanisms of baking enzymes, leading to more improved products. Texture Analysis can aid in quantifying these property alterations.
Many Texture Analysis techniques can be used to test other aspects of bread, from flour’s flow properties to the packaging used for the final product. The range of SMS’s Texture Analyzers combines ease of use with automatic data collection and rapid project-based data analysis. To learn more about our testing techniques, contact your TTC rep to learn more!
References
Chemistry World article, 2009 ‘Not a stale subject’, Bakery Business,Taylor 1998 ‘Characterisation of the staling process of wholemeal bread’, Polish Journal of Food and Nutrition Sciences, Fik 2000 ‘Strategies to stop staling’, Baking and Snack, Stauffer 1996 ‘Effects of enzyme preparations for baking, mixing time and resting time on bread quality and bread staling’, Food Chemistry, Sahlstrom 1996 ‘Comparison of methods for the assessment of staling in bread’, Food Chemistry, Sidhu 1996 ‘Synergistic effect of enzymes for breadbaking’, American Association of Cereal Chemists, Qi Si 1997
Return to Blog Home
More Stories from TTC