Chapter I
Overview of TPA
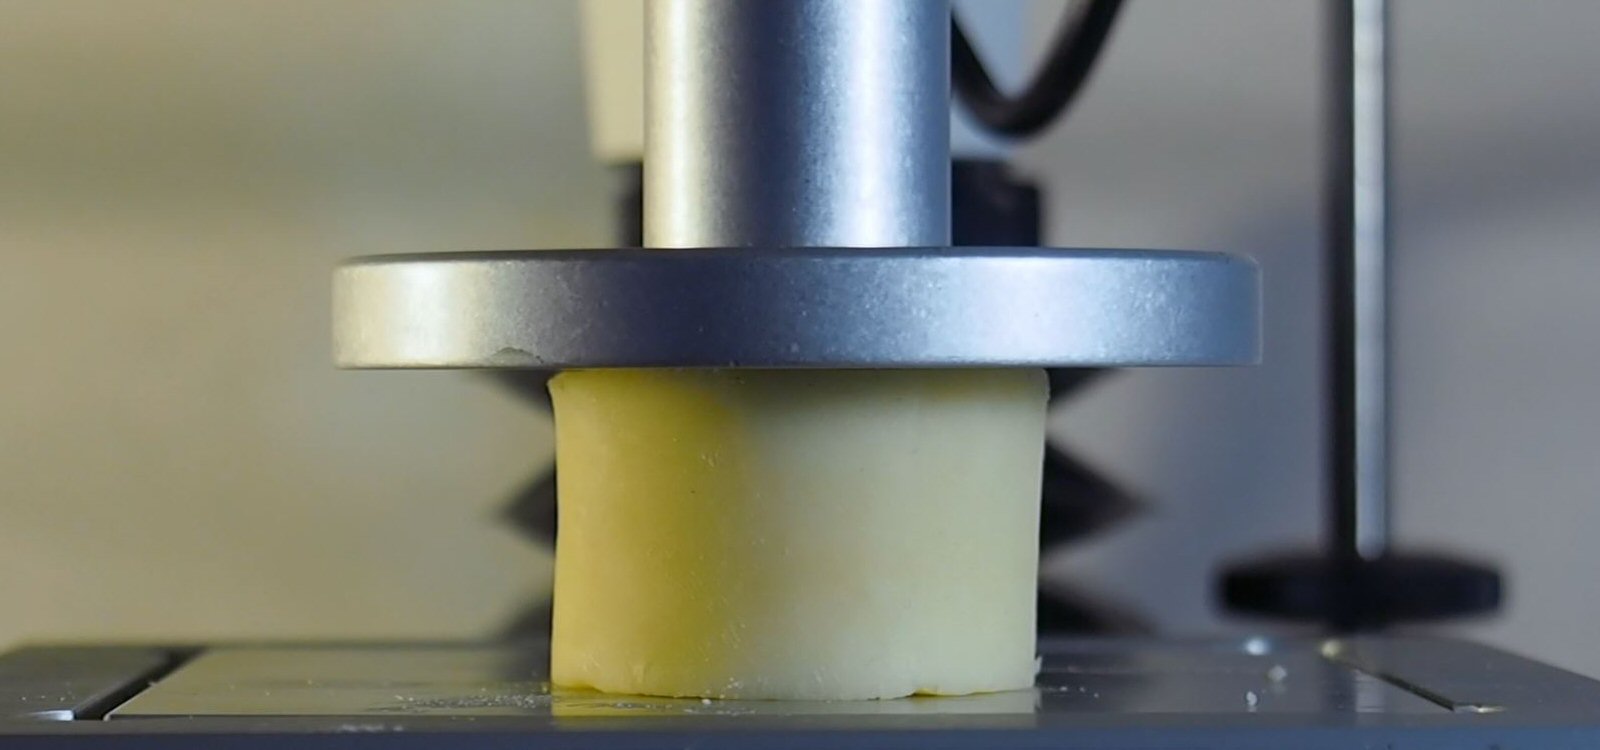
Texture Profile Analysis is a popular double compression test for determining the textural properties of foods. It is occasionally used in other industries, such as pharmaceuticals, gels, and personal care. During a TPA test samples are compressed twice using a texture analyzer to provide insight into how samples behave when chewed. The TPA test was often called the "two bite test" because the texture analyzer mimics the mouth's biting action.
The textural identity of any food is rarely a simple matter of understanding a singular attribute such as hardness or cohesiveness. The texture of any food is multi-faceted and tied to consumers' sensory expectations. It is not sufficient to deliver a food with a target hardness and springiness value if consumers do not like it and it does not meet their expectations for that food type.
The beauty of TPA as an analytical method is that it can quantify multiple textural parameters in just one experiment. That is also the method's curse since many researchers rely on TPA's labeled characteristics without considering whether the test method provides metrics that are relevant to the experimental objective.
TPA parameters have evolved since the test's creation. Through customer feedback and extensive testing Texture Technologies has narrowed its recommended primary TPA characteristics to include hardness, cohesiveness, springiness, and resilience. Depending on the textural attributes sought after by our clients we occasionally recommend capturing either chewiness or gumminess. Adhesiveness is a popular TPA parameter, however, a TPA test technique is not always the optimal method for quantifying adhesiveness, so TPA Adhesiveness should be adopted only after careful review of its suitability as an appropriate metric (see Chapter V for more).
Chapter II
A Brief History
Dr. Alina Surmacka Szczesniak, a food scientist, principal at General Foods, and a founding editor of Journal of Texture Studies, developed the original TPA parameters as part of the sensory work she conducted in the early 1960's at General Foods' Technical Center. Dr. Szczesniak's extensive early publications focused on understanding the textural attributes that consumers experience when consuming a wide variety of food products and classifying them into metrics that could be objectively quantified with trained sensory panels. Dr. Szczesniak developed and improved sensory descriptions for the texture of specific foods while searching for more universal descriptors that could be applied across a broader array of foods. One of the goals was to develop a common lexicon and set of procedures which would allow objective, repeatable sensory texture evaluation tests to be conducted across different laboratories, operators and for many different food types.
While Dr. Szczesniak was advancing the lexicon and techniques to improve sensory texture evaluation (General Foods Texture Profile), her group was also creating an instrument (General Foods Texturometer) which could augment their sensory work and objectively quantify texture. The need for an instrumental approach was critical because, while a sensory texture evaluation was the perfect ideal, it was extremely time consuming and expensive to conduct.
Most of the instruments which substantially preceded the GF Texturometer (shear presses, gelometers, compressimeters, consistometers, tenderometers, etc.) provided single dimension values (e.g. gel strength) and did not address richer food textural characteristics that were discernable from sensory panels. The immediate predecessor, MIT's Strain Gauge Denture Tenderometer A recording strain-gage denture tenderometer for foods. I. Instrumental evaluation and initial tests. B.E. Proctor, G.J. Davison, G. J. Malecki, and M. Welch. 1955. Food Technology, vol 9:471-477.
museum.mit.edu1, was the first successful attempt to measure more than a single attribute at a time, recognizing that the texture of foods were multifaceted. Dr. Szczesniak's research group was able to show strong correlations of the GF Texturometer with sensory judgments and it was the beginning of being able to instrumentally measure more complex textural aspects of foods in an unbiased, scientific manner.
Dr. Szczesniak's pioneering article The Texturometer - A New Instrument For Objective Texture MeasurementThe Texturometer - A New Instrument For Objective Texture Measurement, Herman H. Friedman, James E. Whitney, and Alina Surmacka Szczesniak, Journal of Food Science, Volume 28, pp 390-396 (1963).
Abstract: A new recording instrument, the "texturometer", gave good correlation between instrumental values and subjective evaluation by a trained texture profile panel. It was applied to measurement of the mechanical textural parameters: hardness, cohesiveness, viscosity, elasticity, adhesiveness, brittleness, chewiness, and gumminess. Subjective definitions of these parameters are interpreted in terms of physical measurement characterized by the texture "profile." Examples of representative profiles are included.
Observations: This article put the new instrument in context of a long history (shear press, gelometers, viscometers, compressimeters, consistometers and tenderometers, etc.) of instrumental techniques to quantify textural parameters of foods. The article introduced five basic independent mechanical parameters (hardness, cohesiveness, adhesiveness, viscosity, and elasticity) and three dependent parameters (brittleness, chewiness, and gumminess). Very critically, the article defined how these parameters can be precisely quantified from the strip chart recorder outputs. The article discussed the mechanical aspects of the instrument as well as how it differed from a predecessor instrument, the MIT Strain Gage Denture Tenderometer. It is fascinating to observe the effort it took to translate the voltages generated from the strain gage to objective comparable values and the attention spent on the details of how tests could be conducted to amplify certain measurement aspects. This effort to create a scientifically based, objective texture measuring instrument is a critical reason why this article and instrument became a foundation for the texture measurement industry. introduced five basic independent mechanical parameters (hardness, cohesiveness, adhesiveness, viscosity, and elasticity) and three dependent parameters (brittleness, chewiness, and gumminess). Critically, the article defined how these parameters can be precisely quantified from the strip chart recorder outputs. The article discussed the mechanical aspects of the instrument as well as how it differed from a predecessor instrument, the MIT Denture Tenderometer. It is fascinating to observe the effort it took to translate the voltages generated from the strain gauge to objective comparable values and the attention spent on the details of how tests could be conducted to amplify certain measurement aspects. It is also interesting to note how reliant the tests were on operator skill, and how each class of product tested needed to have its own settings. This effort to create a scientifically based, objective texture measuring instrument is a critical reason why this article and the instrument became a foundation for the texture measurement industry.
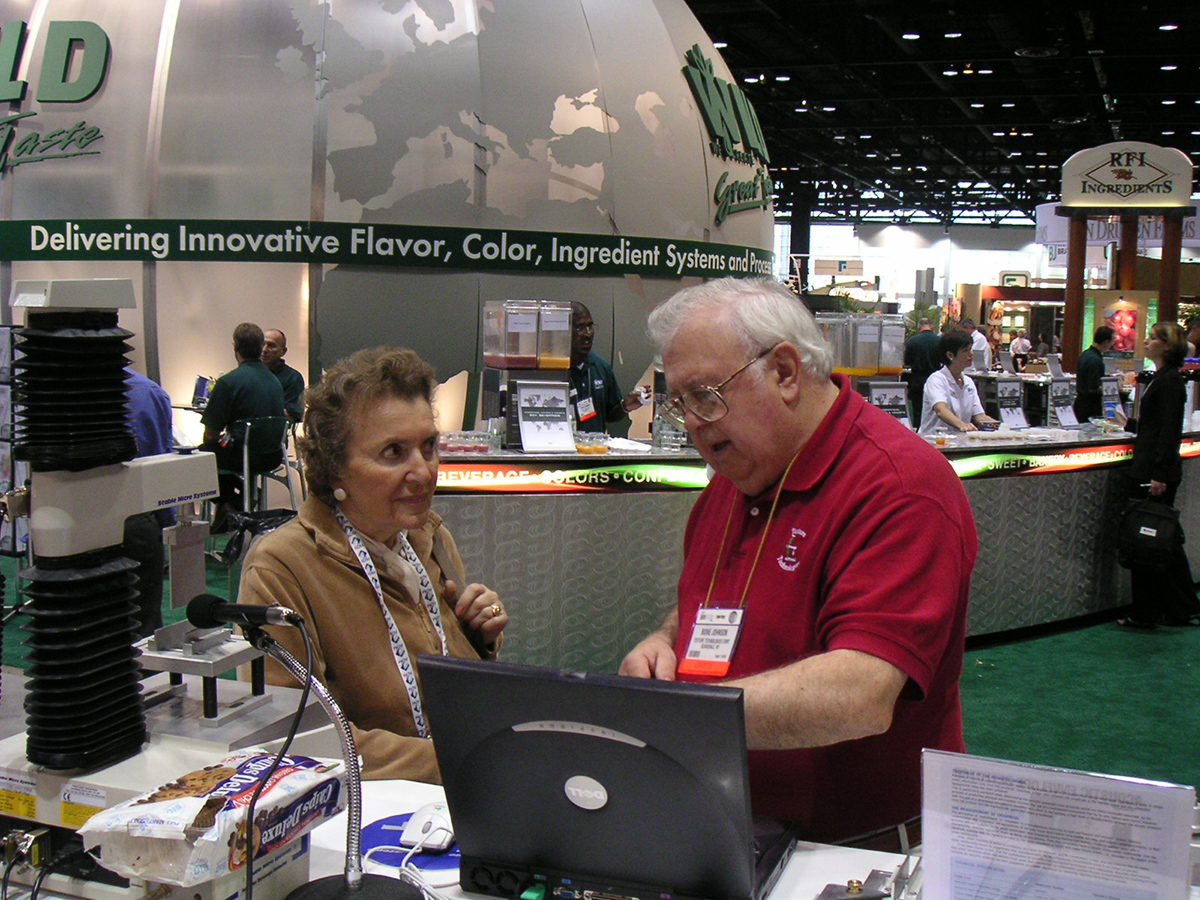
Dr. Szczesniak and Boine Johnson reviewing the TA.XTPlus Texture Analyzer's ability to capture and synchronize sound with force measurements at the IFT Annual Meeting in 2003.
As the use of TPA evolved, so did its terms. Elasticity evolved into 'springiness' since elasticity already had rheological and engineering definitions. Brittleness evolved to 'fracturability', which was perceived to be a more accurate description of the type of breakage that the metric measured.
The General Foods Texturometer had a similar vertical motion as universal testing instruments currently have, but it also had an eccentric cam which generated a sinusoidal movement that allowed it to stress products in a fashion that was more imitative of jaws chewing. Due to its pivot point the initial contact with the product was less parallel with the base than it was at the bottom of the stroke. The instrument's transducer experienced a significant amount of deflection which needed to be accounted for when more fundamental tests were conducted. The deflection was so great that strain data could not be reliably presented from tests generated with the instrument.
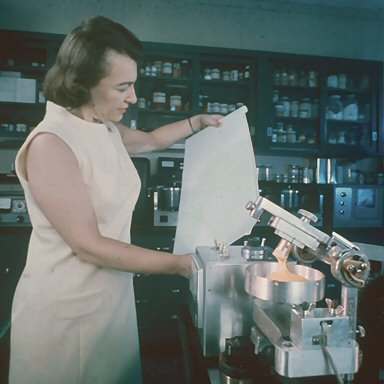
Dr. Alina Szczezniak with the GF Texturometer (photo courtesy of Dr. Malcolm Bourne)
Nevertheless, it was very effective at quantifying the textural characteristics of a wide variety of products1) Some Experiences With The General Foods Texturometer, J. G. Brennan, R. Jowitt, O. A. Mughsi , Journal of Texture Studies, Volume 1, issue 2, pages 167-184, March 1970
Abstract: As part of a programme of investigation into the effects of processing on the texture of food the General Foods Texturometer was adopted, because it appeared to offer versatility, multiple-property determination and a fair degree of objectivity.
2) An Analysis of The Action Of The General Foods Texturometer , J.G. Brennan, R. Jowitt, Anda. Williams, National College Of Food Technology, University of Reading, Weybridge, Surrey, England (Received 24 September, 1974)
Abstract: The action of the General Foods Texturometer is studied in some detail and an analysis of the arctuate movement of the plunger together with the deflection of the sample supporting plate is described, enabling conversion of the force-time trace to one of force-distance. Relationships between the stress and corrected penetration depths are presented for both plunger and human incisor tooth, involving both arctuate and vertical actions. Using rubber and several different foods as test materials results indicate that for both plunger and tooth, during the normal action of the Texturometer, a high initial excess stress develops and disappears around a penetration depth of 3 mm for a 12.8 mm thick sample.
3) Application Of The General Foods Texturometer To Specific Food Products, Alina S. Szczesniak, Bertrand J. Hall, Journal of Texture Studies, Volume 6, Issue 1, pages 117-138, March 1975.
Abstract: The application of the Texturometer to a variety of foods is discussed. Illustrative data are reported for puddings, whipped toppings, cold cereals, potato chips, bread at different stages of staling, frankfurters, French fried potatoes, chocolate, etc. A one-kernel technique for rice is described and correlations with sensory evaluation for specific products are discussed. It is emphasized that optimum conditions of testing must be established for each class of products to parallel the human being who alters the manner of manipulating food in the mouth depending on its textural characteristics. Instrument conditions found adequate for testing different foods are given., among them puddings, whipped toppings, doughs, rice, crackers/cookies, cold cereal, potato chips, bread, fruits & vegetables, hot dogs, French fries, chocolate, and even dog food.
In 1968 Dr. Malcolm Bourne (Cornell University Professor Emeritus of Food Science and Technology and the author of "Food Texture and Viscosity: Concept and Measurement") published work which adopted the TPA concepts from the General Foods Texturometer and applied them with a universal testing machine (Instron). It was an important breakthrough because universal testing machines were commercially available, and thus the Texture Profile Analysis method became queued up for replication by other researchers.
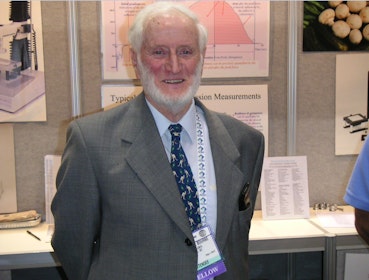
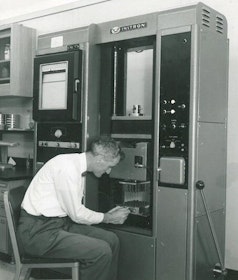
Dr. Malcolm Bourne, above, and with his 1962 Instron (photo courtesy of Dr. Malcolm Bourne)
Early published TPA work included Dr. Bourne's article 'Texture Profile of Ripening Pears' (1968)Texture Profile of Ripening Pears, M. C. Bourne, Journal of Food Science, Volume 33, Issue 2, pages 223-226, March 1968.
Summary: Pears of the Ovid variety were harvested at the normal stage of maturity, and ripened in a 70oF storage room. Samples of the fruit were taken out at regular intervals for texture measurements which consisted of the Magness-Taylor pressure test and a modified General Foods Texture Profile. The adhesiveness of the pears was zero. The viscosity of the whole fruit could not be measured. All other parameters of the G. F. Texture Profile (hardness, cohesiveness, elasticity, brittleness, chewiness, and gumminess) decreased during ripening at approximately the same rate as the pressure test. It is suggested that this characteristic of ripening pears is responsible for the success of a simple single measurement (the puncture test) for measuring the complex phenomenon that is called "textural quality" of pears. and 'Texture Profile of Ripening Peaches' (1974)Texture Profile of Ripening Peaches, M. C. Bourne, Canadian Institute of Food Science and Technology Journal, Volume 7, Issue 1, pages 11-15, January 1974.
Abstract: Clingstone and freestone peaches of varying degrees of ripeness were subjected to a puncture test, a modified G. F. Texture Profile, and a set of rectangular punches that enable a compression coefficient and a shear coefficient to be evaluated.; Sherman on "A Texture Profile of Foodstuffs Based upon Well-defined Rheological Properties" (1969)Sherman,P.: 1969, A Texture Profile of Foodstuffs Based on Well-Defined Rheological Properties, J. Food Sci. 34, 458.; Massey & Woodams on "Effect of Calcium on the Texture Profile of Irradiated Carrots, Beets and Potatoes” (1973)Effect Of Calcium On The Texture Profile Of Irradiated Carrots, Beets And Potatoes, L. M. Massey Jr And E. E. Woodams, Journal of Texture Studies, Volume 4, Issue 2, pages 242-247, June 1973.
Note that this work was conducted under Dr. Bourne's guidance and on his Instron. , which was conducted under Dr. Bourne's guidance and on his Instron.
In 1975 Dr. Szcsesniak published a fascinating retrospective in the Journal of Texture Studies. It acknowledged the many contributors who advanced the science behind sensory and instrumental texture evaluation. It recognized the empirical vs fundamental debate that was prevalent at the time and, which still continues today. It called out the importance of having an effective, practical tool for food scientists to immediately use while the industry waited for the scientific community to further develop the rheological and fundamental underpinnings that came in the late 1990's and 2000's. It accepted some of the then contemporary criticism and embraced terminology changes in elasticity to springiness and brittleness to fracturability. It reinforced the need for instruments to bridge sensory experience with the rheology theory. It recognized the need for instruments to be able to measure standards, and essentially predicted the need for calibratable, traceable methods that could be used worldwide. It predicted the need for sensory and instrumental texture research that, with hindsight, we know occurred over the following two decades. Dr. Szczesniak's group and peers had advanced a tool to help provide objective, practical methods for quantifying food texture.General Foods Texture Profile revisited - Ten Years perspective, Alina S. Szczesniak, Journal of Texture Studies, Volume 6, Issue 1, pages 5-17, March 1975.
In 1975 Dr. Bill Breene's work on TPA explored the impact of different test and chart speeds as well as different strain rates. It was an important article because it showed that testing conditions can make an enormous difference, called for more thoughtful and higher quality experimental designs, and cautioned researchers about how to interpret the analysis. All of Dr. Breene's observations remain valid today (see Sections 3, 5, 8).Application Of Texture Profile Analysis To Instrumental Food Texture Evaluation, William M. Breene, Journal of Texture Studies, Volume 6, Issue 1, pages 53-82, March 1975 (Scientific Journal Series Paper No. 8743, Minnesota Agricultural Experiment Station, St. Paul, Minn. 55108, U.S.A.).
Abstract: Although the Texturometer was used in establishing the GF objective Texture Profile Analysis (TPA) of foods, it has been largely supplanted by the Instron. The Instron GF TPA parameters have been determined for the most part by the original Texturometer procedures. Some workers have chosen to measure only one or several of the GF TPA parameters; others have added new ones. Changes proposed to make parameter names more descriptive have not been universally adopted. Testing conditions (crosshead and chart speed, % deformation, etc.) have varied considerably and have often been poorly described. Multiple point non-GF TPA has been performed on foods using homemade as well as commercial instruments, e.g., Instron, Ottawa Texture Measuring System. Major shortcomings of studies involving TPA include poor experimental design, absence or improper use of statistical analysis and incomplete description of experimental materials and testing conditions. Despite certain shortcomings, TPA (GF or non-GF) via interpretation of stress-strain curves is, and will continue to be, extremely useful in evaluating the textural quality of foods, particularly when parameters can be correlated with sensory assessments.
It is important for current food scientists to keep in mind that when TPA was developed and improved in the 1960's and 1970's personal computers were not yet available. Quantifying data in those years required strip chart recorders, rulers, and planimeters. It was also common to count area squares or even weigh strip chart recorder paper traces in order to quantify areas of work. It was an art to precisely measure sections of a strip chart recorded curve, and comparisons across labs were even more difficult because of differences between brands and speed settings of strip chart recorders. Analyzing the data took skill and patience and was not for inexperienced operators. The early Instron computer system was extremely difficult to use and was not designed to capture the metrics relevant to food texture, so early researchers were always designing better ways to capture and analyze the data.
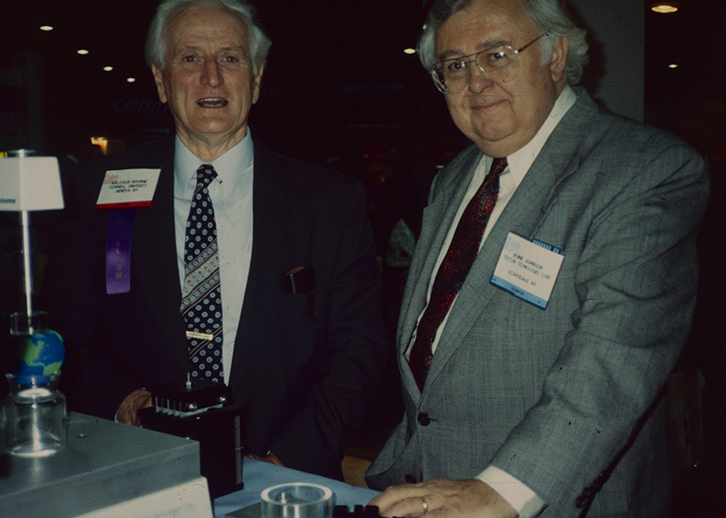
Boine Johnson with Dr. Malcolm Bourne in the early 1990s
Dr. Judith Abbott wrote an insightful article (with Massie & Watada)The Use Of A Computer With An Instron For Textural Measurements, J. A. Abbott, D. R. Massie and A. E. Watada, Journal of Texture Studies, Volume 13 pp 413-422 (1982).
Abstract: A minicomputer was interfaced with an Instron so that force/deformation tests could be performed and analyzed automatically. The equipment eliminates time consuming measurements and transcription of data from recorder charts. The data extracted include force, deformation, slope and area variables not previously reported as well as the usual texture profile parameters. Procedures and analyses are illustrated by texture profile measurement of apple tissue. Comparison of visually and computer selected force at failure indicate satisfactory computer identification of the Texture Profile "fracturability" parameter, the parameter most difficult to interpret for apples. in the 1980's which involved writing BASIC code to digitize Instron data into minicomputers. She had to fully understand the instrument's electrical and mechanical systems in order to precisely control the instrument and thus have a rigorous digitized output that could be readily analyzed. Her article helped address how to objectively quantify elements of a chart, which was mostly an art up until that point. It illustrated how difficult it was to create algorithms that quantified standard graph characteristics (such as slopes, valleys, work to failure, etc.) because of the limited technology available and because so many different products generated highly inconsistent shape curves. She also published several articles on the sensory and textural profiles of apples.Sensory and Instrument Measurement of Apple Texture, Judith A. Abbott, Alley E. Watada, and David R. Massie, Journal of the American Society for Horticultural Science Volume 109 (2):221-228 (1984).
Abstract: The relationships among selected sensory textural attributes and data from modified Instron texture profile analysis (force/deformation curves obtained in compression of tissue cylinders) were examined for 'Golden Delicious', 'Rome Beauty', 'York Imperial', 'Redspur Delicious', and 'Miller Sturdy Spur Delicious' apples (Malus domestica Borkh.). Sensory crispness, hardness, and toughness were closely related to each other and to Instron texture profile forces at breakpoint (yield), failure, and 75% compression and to work energy in compression and rebound. Correlations of sensory attributes with the best single Instron texture profile variables were similar to those with Magness-Taylor penetration force (measured on an Instron); however, combinations of several texture profile variables in regression equations generally improved prediction of sensory attributes. Experimental Instron texture profile variables, especially force near midcompression, or the experimental variations on the customary variables, such as mean forces around failure and around full compression, were selected for prediction equations more frequently than the customary variables.
In 1988 Stable Micro Systems (SMS) introduced the TA.XT2 Texture Analyzer and software which automated the analysis and gave researchers a vastly improved tool to conduct TPA tests. Originally, this capability showed up in the XTRAD software and was later ported to the Texture Expert, Expert Exceed and Exponent versions of the software. Since the late 1980's-early 1990's all of these programs gave researchers the ability to easily calculate TPA attributes with calibratable, traceable, repeatable test settings and analytical methods.
Mr. Boine Johnson of Texture Technologies Corp played an important role in promoting Stable Micro System’s equipment and software among academic, institutional and commercial researchers in North America.The breadth of early adopters of the equipment shaped texture related research for several decades. Stable Micro System's software also introduced the concept of easily programmable macros which could consistently quantify elements of curves, even if those curves were very different shapes. The macros could also be shared between labs so that others could precisely duplicate the exact same analysis. The software also popularized the ability to simultaneously overlay multiple curves so that subtle differences could be observed. As SMS' TA.XT2 and then the TA.XT2i Texture Analyzers became more popular in the food industry, so did the growth of TPA as an easy method to characterize the texture of most types of food products.
Most of the review papers dealing with TPA methods express a need for researchers to carefully think through the suitability of their speeds, protocols, compression depths and other test methods. Both Stable Micro Systems Ltd and Texture Technologies Corp, have built in those cautions into our guidance notes on using TPA, into our default software TPA Projects, and into our training materials on how to conduct TPA tests.
In 1998 Dr. Szczesniak wrote a Letter to the Editor of the Journal of Texture Studies on Issues Pertaining to the Texture Profile Analysis. Dr. Szczesniak recognized some improvements to TPA and cautioned about other changes to TPA that were not yet of demonstrated usefulness. Among her observations was her favorable opinion about using only the downstroke areas for cohesiveness calculations (adopted in TTC's "Modified Cohesion TPA" project, described below). She expressed deep concerns about researchers trying to apply the TPA methodology on inappropriate products, where the TPA attributes would not be applicable (e.g springiness of a hard candy). Dr. Szczesniak clarified that chewiness is for solid foods and gumminess is for semisolid foods and she embraced how some researchers thoughtfully used and pushed forward the TPA methodology.Issues Pertaining to the Texture Profile Analysis Dr. Alina S. Szczesniak, Letter to the Editor Journal of Texture Studies Vol 29, 1998 (vii-viii). Dr. Szczesniak wrote an excellent letter to the editor discussing the use and misuse of the TPA method. Researchers should be familiar with Dr. Szczesniak's observations: article 1 and article 2.
Dr. Bourne, editor of the Journal of Texture Studies at the time, echoed Dr. Szczesniak's observations and has been very involved in the industry throughout the 1980's, 1990's and even since the turn of the century, as a steady advocate of properly and thoughtfully using TPA methodology for many different products. He has also kept researchers grounded by continually reminding them of the history of TPA, how it came about, and of the effort of so many people that stand behind the TPA method and texture analysis in general. Dr. Bourne has always advised researchers that they should closely observe their products during testing instead of watching the graphs be plotted. We concur, since the only way to truly interpret TPA test data is to first understand the product behavior that the TPA method is trying to quantify.
With the popularity of the TA.XT2, TA.XT2i and TA.XTPlus Texture Analyzers thousands of research and commercial laboratories have been in a position to conduct TPA tests on an extremely wide array of food products. The common worldwide toolset has allowed researchers to cross-compare TPA test data and test settings. Much of the work is excellent and novel, but occasionally research is still published using inappropriate TPA nomenclature or methods. The purpose of this extensive page on Texture Technologies Corp's website is to help researchers improve the quality of their application of the TPA principles.
We would also like to thank Dr. Szczesniak, Dr. Bourne, Dr. Breene, Dr. Abbot and so many others for creating the foundation that we collectively have been building upon for the last twenty-five years.
Chapter III
Instrument Settings and TPA Guidelines
Texture Profile Analysis tests must be conducted with correct test settings otherwise some of the more important values will not be calculated correctly. A screenshot example of TPA settings from an Exponent software TPA sequence is shown below. Please note that this example is NOT the only settings possible for TPA tests, nor are they TTC's recommended TPA settings for testing any particular product.
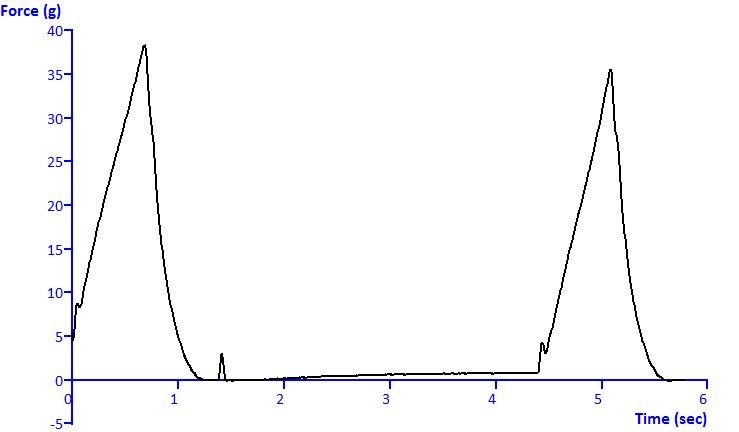
In TPA tests the probe descends at the pre-test speed while the TA.XTPlus Texture Analyzer searches for the top of the sample. The instrument begins recording data as soon as the automatic trigger is achieved at the specified trigger force. The probe then compresses the sample at the test speed and travels the target distance or percent strain. Once it has achieved the target distance or strain the probe ascends to the original trigger position at the test speed. The instrument then waits for the target time before the second compression occurs at the test speed. The probe finally ascends all the way to the starting position at the post-test speed.
Note that the wait time between cycles can influence whether the samples have enough time to recover between cycles. If you wait too long, then many samples which might otherwise have very different spring back evaluations according to sensory panels might appear similar. The opposite is true as well. If you do not wait sufficiently between strokes, then perhaps the product will not have time to spring back and springiness metrics will also not correlate well with sensory scores.
Recommended TPA Test Method Guidelines
- Select an appropriate probe.
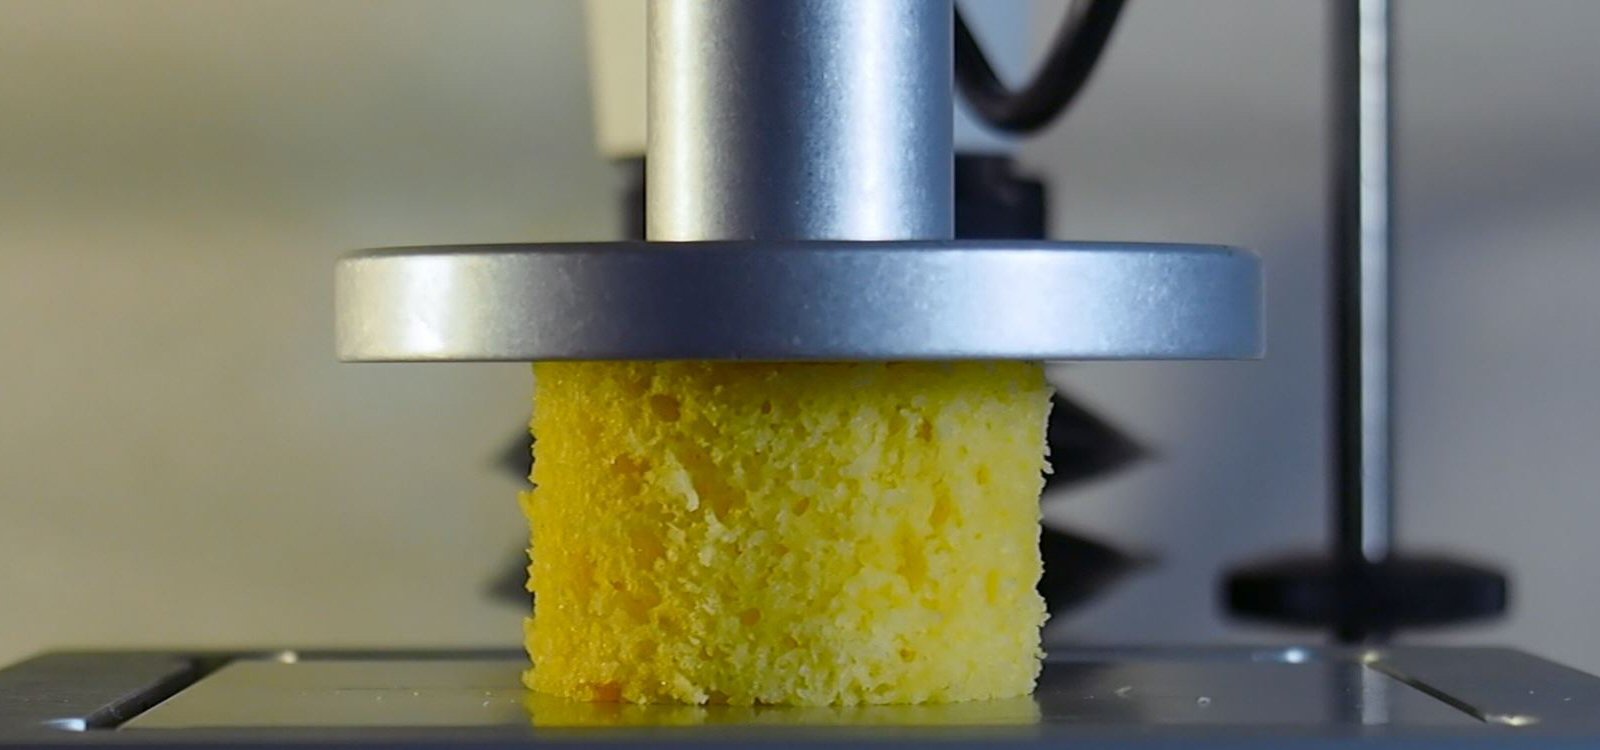
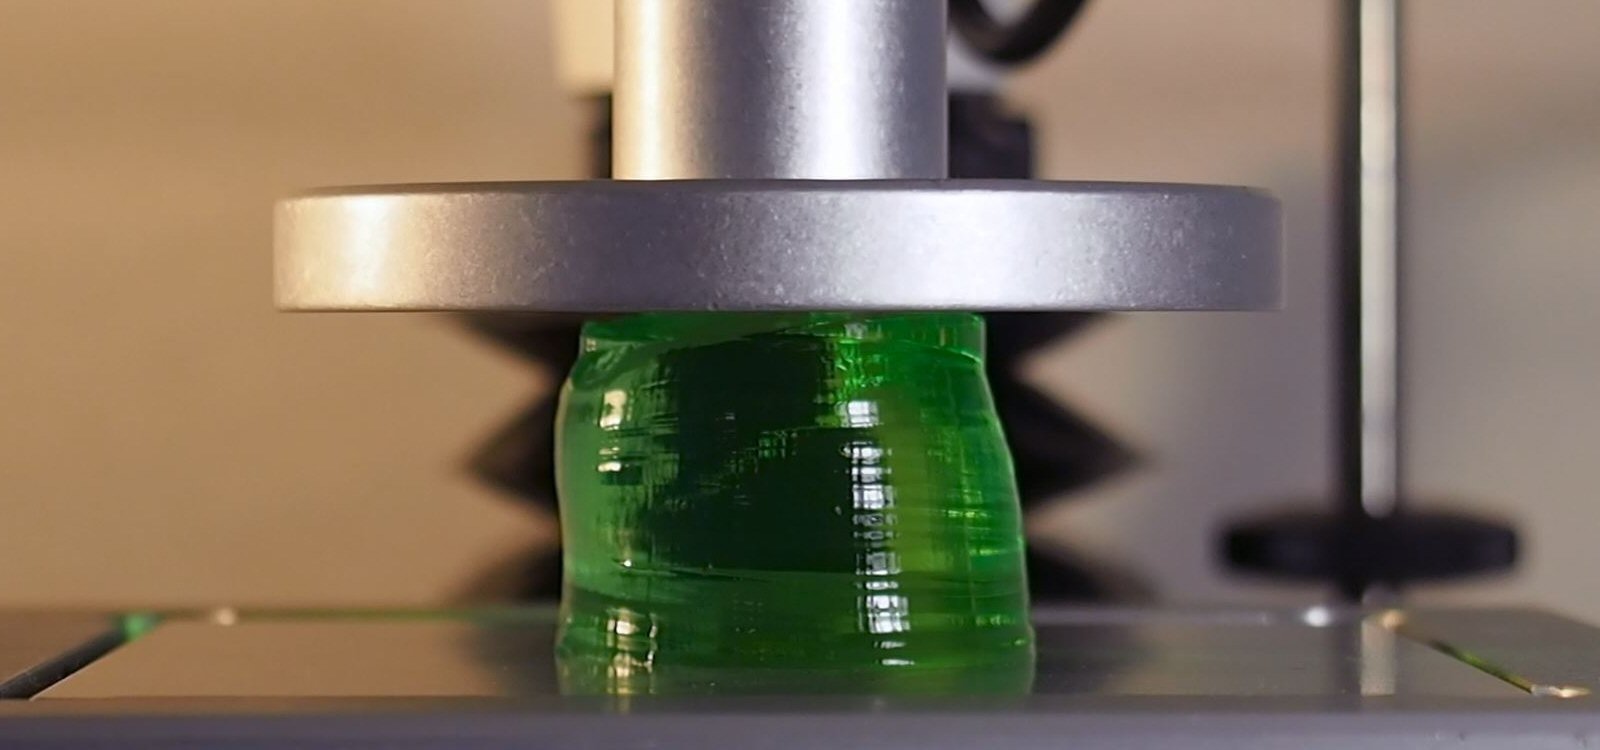
Ideally users should use flat probes or compression plates which are larger than the samples' diameter so that the product can barrel out and still be fully contacted and properly compressed. Note that a probe which is adequate for low strains may no longer be suitable under higher strains because of how the product behaves during compression (see the Section 6 photos below of Hot Dog & Jello at 75% strain). Since there is little drawback for using larger diameter probes, consider erring on the larger size for TPA probe selection. Occasionally it is acceptable to test products which are larger than the probe, such as sheet cakes, muffins, breads, with the understanding that if the probe breaks through and penetrates into the product then the resilience, springiness and even cohesiveness values should be looked at skeptically (since the ability of the compressed product to spring back may be unduly negated by friction and side walls of the penetration hole).
Smaller diameter puncture probes typically do not work well for TPA because they do not replicate the biting action well. These probes, including cone probes for some products, penetrate or shear into the samples and thus create holes in the products which completely obviate products' ability to spring back or be progressively compressed as if chewed.
Do NOT use thin knife blades or Kramer Shear Cells or Ottawa style extrusion cells for TPA tests. These probes shear or destroy the samples and do not allow the recovery elements that are critical for TPA calculations. Researchers may obviously use these types of fixtures to evaluate their products, but should refrain from calling the experimental values TPA results.
- Set the same speed for compression and withdrawal.
In order to properly calculate many TPA parameters the tests must be conducted with the same speed for both the compression and the withdrawal phases (same Test and Post-Test Speeds).
- Experiment with multiple compression distances or percent strains to determine the optimal maximum distances of compression.
The original TPA work used 80% strain. Most of Dr. Bourne's TPA research was conducted at 90% strain. The premise was that most foods should be chewed very fully in order to successively break up the mass until it is acceptable to swallow. If breaking up the food until it is palatable to swallow is the test objective, then by all means test products using strains approximating 66% to 80%. As shown in the Section 6 pictures, however, strains approximating 75% are extremely destructive, and while the test may emulate chewing action, it often is too destructive to allow subtle differences food scientists explore between formulas or processes to be detected.
While very few users still use the extreme 80% strain for their TPA tests, it is important to have an understanding of the test premise and thus what percent strain or distance might be appropriate to evaluate for their products. We strongly recommend that users conduct TPA tests using different compression distances or percent strains and choose a final distance or strain only after observing their products' behavior and considering what strain is suitable for their test's objective. We have had excellent results with strain values between 25% and 50% on most classes of products.
- Keep it simple.
When possible use the "Simplified TPA" versions of the TPA project that is preloaded in the latest version of the Exponent software, or is available through your TTC regional manager. The Simplified TPA project streamlines and consolidates the analysis of TPA tests. It uses an advanced macro to analyze TPA curves and does not require a separate TPA results file.
- Consider using Modified Cohesion.
Strongly consider using the "Modified Cohesion" version of the "Simplified TPA" project which is also available through your TTC regional manager ("Simplified Modified Cohesion TPA" project). This project uses the modified cohesion calculation which uses only the downstroke energy from both the first and second cycles to calculate the cohesion value (and thus also the Gumminess or Chewiness values). In many cases, but not always, it will track the original cohesiveness calculation.
- Use an appropriate TPA parameter.
Anyone applying a TPA test method on products will automatically generate values for all of the standard TPA parameters. However, for many food products those parameters may be completely meaningless, as addressed in Dr. Szczesniak's letter to JTS editorIssues Pertaining to the Texture Profile Analysis Dr. Alina S. Szczesniak, Letter to the Editor Journal of Texture Studies Vol 29, 1998 (vii-viii). Dr. Szczesniak wrote a letter to the editor which discussed the use and misuse of the TPA method. Researchers should be familiar with Dr. Szczesniak's observations: article 1 and article 2. about using TPA on a Lifesaver which provided springiness values for a candy that was crushed and thus the springiness aspect would be meaningless. Review Section 4 below and then carefully choose which TPA metrics may be appropriate for your product.
- Choose a wait time between the two cycles that is appropriate to the test's objective.
We have read multiple publications with seemingly excessive wait times. Many products, given enough time, will completely spring back to their original heights. Spring back under long wait times may not be realistic, since many products are chewed or experienced relatively fast in real time.
- Do NOT use TPA for many textural attributes.
TPA is an inappropriate test method for many products (purees, almonds, hard candy, peanut butter, caramel, etc.) because those products do not have the primary attributes that TPA measures (springiness, chewiness, cohesiveness). If you are primarily interested in adhesion, then conduct an adhesive test. If you are primarily interested in how brittle or fracturable a product is, then conduct a three point bend test. Do NOT force a TPA method onto products simply because the TPA method provides nicely labelled results.
- Do NOT conduct tests which deviate greatly from TPA methods and then call those values TPA.
We have seen TPA tests done with more than two cycles, or with cycles to different depths, or with cycles at different test speeds, or with tests with relaxation segments at the downstroke of each cycle. These ideas may be of interest and may even produce interesting results that correlate nicely with some research objective, but they are not TPA tests and should not be labeled as such.
- Only Use Parameters Applicable to Your Products.
Users should consider the parameters they are interested in when they design their experiments and they should only use those metrics which are applicable to the product being tested. Chocolate is usually not springy and testing for it will not yield any useful data. Likewise, bread is typically not adhesive so testing for adhesiveness is not useful. Since there is currently no standardization of TPA parameters researchers are responsible for self-regulating/monitoring their proposer use of TPA parameters and test methods.
- Whenever making modifications to the original parameters, choose wisely.
Some TPA modifications are not useful and are not done for the right reasons but many are. The best TPA modifications are adopted because the scientists are trying to highlight attributes of the products that they are testing.
- Plan and time your sample setup carefully.
Temperature, humidity, sample preparation, sample size and sample shape, etc all can affect the test results. A properly designed experiment includes using clear TPA test settings, but also includes a well-defined set of protocols addressing the testing environment and sample presentation.
- Use an Appropriate Fixture.
TPA tests should NOT be conducted with Kramer Shear cells, multiple puncture cells, cone probes (with rare exceptions), knife blades, forward extrusion or Ottawa cells, etc. All of these fixtures do not generate the chewing action that the TPA method was originally designed to emulate. While these tests may generate statistically differentiating results, and may even have strong correlations with formulation problems, they are not in harmony with the objectives that TPA was designed for and the parameters should not be referred to as TPA values.
- Choose a compression pattern that is suitable for the food type, test objective and target consumer.
Groups of consumers experience the same foods differently (by age, by nationality, by chewing type(0)) and the choice of compression distance or strain should be consistent with the research objective and how the target consumers experience the food.
Chapter IV
What does TPA measure?
At Texture Technologies we work with a modified list of TPA parameters based on our years of experience helping customers determine the best methods and parameters for their TPA tests. When we evaluate possible modifications, we first consider the attributes of the products that we are testing. Common sense is important in making these evaluations.
We excluded "Stringiness", one of the original TPA parameters, because most tests start and finish close to the original surface of the product. In most instances there is not enough distance between the probe and sample at the conclusion of each test for a meaningful calculation of stringiness to be made. If stringiness is a desired metric, then we recommend that a separate test be conducted with a substantially higher ending point that would generate a more meaningful stringiness value.
SMS and TTC have added 'Resilience' to our recommended TPA parameters, which we define as a measure of how well a product fights to regain its original shape and size. In our experience 'Resilience' has some similarities to 'Springiness', however, in a great many instances products actually spring back (recover their height) differently than the energy they exert to recover their shape.
Parameter
Expression
Measurement
Hardness
The peak force that occurs during the first compression. The hardness need not occur at the point of deepest compression, although it typically does for most products.
Maximum force of the first compression.
Same
Fracturability
Not all products fracture; but when they do fracture the Fracturability point occurs where the plot has its first significant peak (where the force falls off) during the probe's first compression of the product.
The force at the first peak.
Peak force at F1
Cohesiveness
How well the product withstands a second deformation relative to its resistance under the first deformation.
The area of work during the second compression divided by the area of work during the first compression.
Area 2/Area 1 optional (similar, not identical): Area 5/Area 4
Springiness
How well a product physically springs back after it has been deformed during the first compression and has been allowed to wait for the target wait time between strokes. The springback is measured at the down-stroke of the second compression. In some cases an excessively long wait time will allow a product to springback more than it might under the conditions being researched (e.g. you would not wait 60 seconds between chews).
Expressed as a ratio or percentage of the original downstroke compression. Springiness is measured several ways, but most typically, by the distance of the detected height during the second compression divided by the original compression distance.
Distance 2 / Distance 1 optional (same value): Time 2/Time 1
Gumminess (semi-solids)
Gumminess applies only to semi-solid products and is Hardness * Cohesiveness (which is Area 2/Area 1).
Gumminess is mutually exclusive with Chewiness since a product would not be both a semi-solid and a solid at the same time.
Hardness x Cohesiveness
Chewiness (solids)
Chewiness applies only to solid products and is calculated as Gumminess * Springiness (which is Distance2/Distance1).
Gumminess * Distance 2 / Distance 1
Hardness x Cohesiveness x Springiness
Resilience
Resilience is how well a product "fights to regain its original height". Resilience is measured on the withdrawal of the first penetration, before the waiting period is started. Resilience can be measured with a single compression; however, the withdrawal speed must be the same as the compression speed.
Calculated by dividing the upstroke energy of the first compression by the downstroke energy of the first compression.
Area 4/Area 3
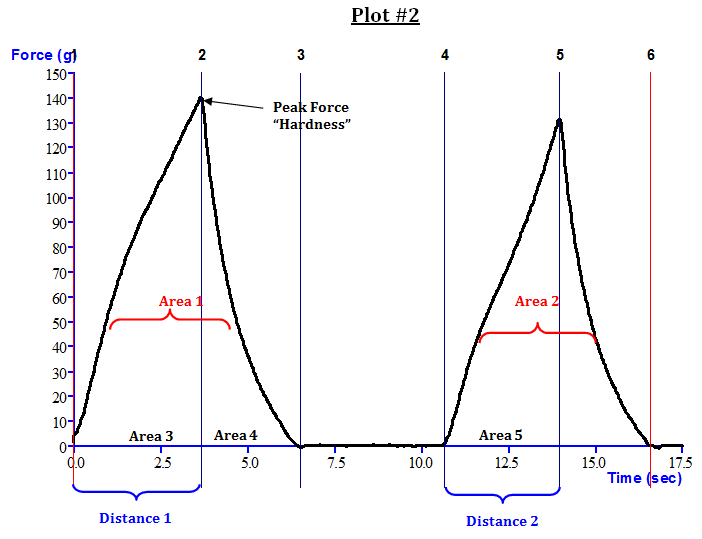
Stable Micro Systems' standard TPA macros, included with the Exponent software, quickly calculate all of these TPA parameters. Macros work by sequentially stepping through the TPA graphs, marking significant anchor points. These anchor points are then used to automatically calculate the relevant areas under the curve, peak forces and distances travelled. Please keep in mind that all of SMS' software programs use force thresholds so that the analytical macros can automatically calculate the areas and distances of each graph. Researchers should carefully review their results to ensure that the macros are consistently picking up the correct behaviors, particularly if the products are highly brittle or the curves exhibit a high degree of noise. In those cases a user might need to adjust the default force threshold from 5 grams to some other value depending on the load cell that is being used and how the product’s behavior to being compressed.
Chapter V
Discussion of Hardness, Cohesiveness, Springiness, Gumminess and Adhesiveness
About Quantifying Hardness
The original articles introducing TPA described Hardness as the height of the first peak (on strip chart plots). In almost all of those articles the example graphs, including those with small fracture events, showed peak forces that occurred at the deepest compression. The articles all described Hardness as the peak force that occurs during the first compression even though with hindsight we understand the recorder technology did not well-differentiate between peak forces due to fractures and peak forces due to stopping the compression stroke.
Stable Micro System's and Texture Technologies' TPA macros use the absolute peak force on the first downstroke as Hardness. If your macros do not use the absolute peak downstroke force, then either modify your macros or ask your Texture Technologies' Regional Manager for assistance to modify the macros accordingly.
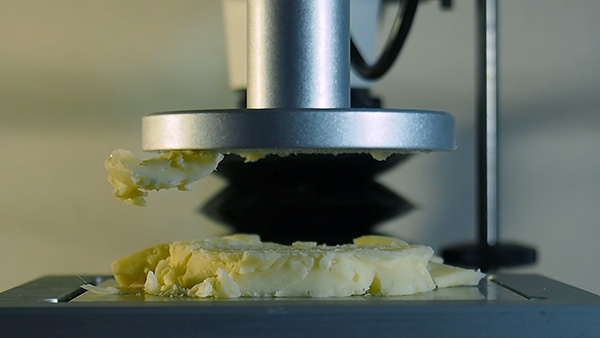
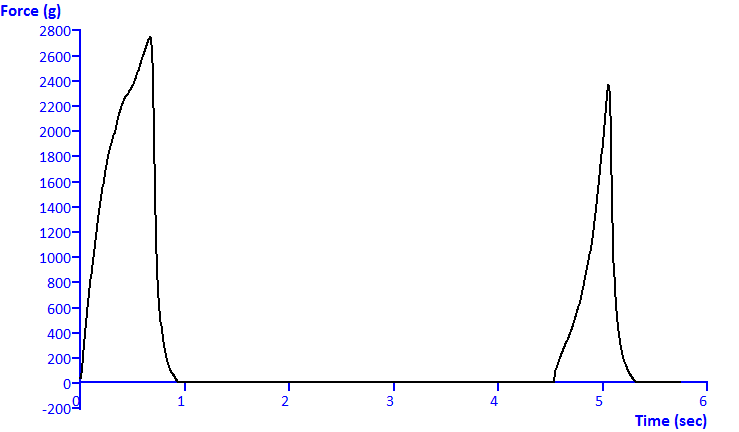
It is not uncommon to find articles that use the force at the deepest compression as Hardness even when higher forces might have occurred earlier in the downstroke (when the products' fractured -as shown in the below cheddar cheese or cookie dough plots). Researchers should be careful that they use the highest force on the downstroke as Hardness, no matter where it might occur during the compression.
Another problem researchers have with Hardness is that their correlations with sensory tests are not always as high as expected. Examine, for example, the test plots shown below for Hot Dogs. The hardness values for 25%, 50% and 75% strains are approximately 1,900 grams, 6,100 grams, and 6,600 grams, respectively. Obviously, when the hot dogs are compressed the incremental 25% to 75% strain the sum of the energy is greater (as shown by the area of work) than is apparent with the incremental peak force. In this, and many other instances, the metric of peak force does not adequately replicate the energy experienced by consumers. Researchers should understand that consumers' judgments of Hardness can be more nuanced than a simple peak force metric and in some instances might be able to attain better correlations with the downstroke area of work.
Dr. Bourne has noted that even small incremental compressive strains can result in very large increases in firmness values (e.g. Jelly Bean or Pound Cake data below). If hardness values exhibit significant variability researchers should explore the possibility that the incremental strains may be accidental due to inconsistently presented or cut samples. Older Instrons or low end texture analyzers do not provide users enough control over the initial product contact and thus can generate more variable hardness results. In those cases researchers should pay more attention to how each test is commenced as part of the test protocols.
Researchers should keep in mind that TPA forces can be relatively high, even for prducts that are not considered overly hard (e.g. Cheddar Cheese data below). In those instances, consumers might chose to chew more cycles rather than closing their jaws to such tight gaps and experiencing uncomfortably high forces. As always, we recommend that researcher keep the research objective and consumer behaviors in mind when selecting a suitable TPA test setting.
About Quantifying Cohesiveness
The original TPA publication in 1963 used definitions of work for each of the two compressive cycles which included both the downstroke work and the withdrawal work. This is illustrated in Plot#2 as Area 2 divided by Area 1. Subsequent research and guidance from the founders of TPA (see Dr. Alina S. Szczesniak's Letter to the EditorIssues Pertaining to the Texture Profile Analysis: Dr. Alina S. Szczesniak, Letter to the Editor Journal of Texture Studies Vol 29, 1998 (vii-viii), which discussed the use and misuse of the TPA method. and Malcolm Bourne's book)Food Texture and Viscosity: Concept and Measurement, Second Edition, Malcolm C. Bourne, Academic Press 2002 (1982 1st edition)
Abstract: Drawing together literature from a variety of fields, Food Texture and Viscosity, 2E, includes a brief history of this area and its basic principles. It reviews how texture and viscosity are measured, including the physical interactions between the human body and food, objective methods of texture measurements, the latest advances in texture-measuring instruments, various types of liquid flow, and more. This revised edition contains approximately 30% new material, including two new chapters on physics and texture and the correlation between physical measurements and sensory assessments. It now includes two-color illustrations and includes a current list of equipment suppliers. Note that TPA descriptions are on pages 182-186. suggest that the cohesiveness value should be calculated as Plot #2 Area 5 divided by Area 3, which only includes the compressive work and excludes the decompression work. In our experience the relative values will move in lockstep, however, we now recommend that the modified cohesiveness formula be used.
What does Cohesiveness mean?
A product is cohesive when it adheres to itself under some compressive or tensile stress. A piece of pork, for example, is highly cohesive when it takes a great many chews to break down. An extruded snack is cohesive when it can take a compressive deformation and its internal cell structure is not so damaged that it cannot substantially resist a subsequent deformation (think another chew). A wheat bread is cohesive when it can withstand tearing when a cold tab of butter is being spread on it. A pizza slice is cohesive when it withstands a tug of war between your hands and your jaw. These are all different ways of experiencing the same phenomenon - a product whose structural integrity withstands compressive or tensile stress. In foods, the obvious way to experience cohesion is the energy or the number of times it takes to break down the product until it is palatable to be swallowed. Mechanically, many food products will experience a great deal of various stresses even before they are consumed. A product with strong cohesion will be more tolerant of manufacturing, packaging and delivery stresses and thus will be presented to the consumers in its expected state. A product with poor cohesion will not. Think of a loaf of bread that cannot tolerate the stress of being placed in shopping bags and transported home. Or a dry chocolate chip cookie that shatters into a thousand pieces under a first bite. Or a birthday cake that falls apart when icing is applied. A product cannot be 100% cohesive if it is stressed beyond its point of plastic deformation, since it will irretrievably have lost some energy at that yield point.
About Quantifying Springiness
TPA was designed to emulate the sensory chewing experience, and yet thoroughly chewed foods generally do not have sufficiently remaining structural integrity to spring back (refer to Jello 75% and similar high compression videos below). Naturally enough, the more a product is destroyed, the less Springiness it will exhibit. This dichotomy between the destructive purpose of TPA and the method's clear effectiveness at measuring Springiness is inherent with the TPA method. In instances where the objective is to evaluate the relative spring back of different formulations, we recommend less destructive compressive distances so that the product retains enough geometric stability to exhibit relative differences.
Springiness values generated using probes that are smaller than the product (users may occasionally do so with products like sheet cakes, muffins, and slices of bread) can be misleadingly low because probes may break through and penetrate into the product.
Note that it is also possible for some products to stick to the retracting probe so that they are pulled up into their original shapes. In those instances the plots will indicate a greater Springiness then proper. The higher Springiness values should not automatically be discarded, because products that stick to consumers' teeth might also be scored with higher Springiness values. Researchers should be aware of this phenomenon so that they can properly interpret the results or treat their samples to minimize stickiness.
Springiness was initially called "Elasticity" in the original TPA parameters and it was measured as an absolute distance in millimeters. The name was changed because "Elasticity" had other engineering and rheological meanings. The absolute distance metric made it nearly impossible to precisely compare springiness values between samples which were of even slightly different heights, so the Springiness metric has evolved into being expressed as a ratio.
About Quantifying Adhesiveness
The original TPA publication in 1963 described Adhesiveness as a primary TPA parameter. At Texture Technologies Corp we treat it as a secondary parameter since there are much better ways to quantify adhesion than with a TPA test. The TPA sequence involves contacting a product, compressing that product, withdrawing to the original contact point, then repeating the entire cycle a second time. Adhesion is measured as the negative work between the two cycles, however, in many instances the product has stuck to the probe and does not actually separate when the highest point between the two cycles is just back to the original product height. The metric does not also work for many products (e.g. some cheeses) that are pressure sensitive. In those cases a harder product also creates more pressure between the product and the base and thus may also create and improved bond (apparent adhesion). It is not surprising that the TPA method suggests that those products are more adhesive. Thus reviewers should look skeptically at publications in which harder products appear to also have higher adhesiveness.
It is not uncommon for highly adhesive samples to be partially lifted during the decompression stroke, particularly since samples are rarely fastened down during TPA tests. Accordingly, we recommend that researchers specifically interested in adhesiveness or stickiness actually conduct adhesive tests rather than use the TPA method.
About Gumminess
Gumminess is only applicable to semi-solids and is mutually exclusive with Chewiness since a product would not be both a semi-solid and a solid at the same time. TPA is not a suitable tool for all semi-solid products. It is suitable for many gels, soft cheeses, desserts such as flans, etc. It is an inappropriate metric for some semi-solids, such as purees, yogurts, and sauces, since those products would not have the fracturability, springiness, resilience, and cohesiveness attributes that are associated with chewing products.
Chapter VI
Examples of Products Tested Using Texture Profile Analysis
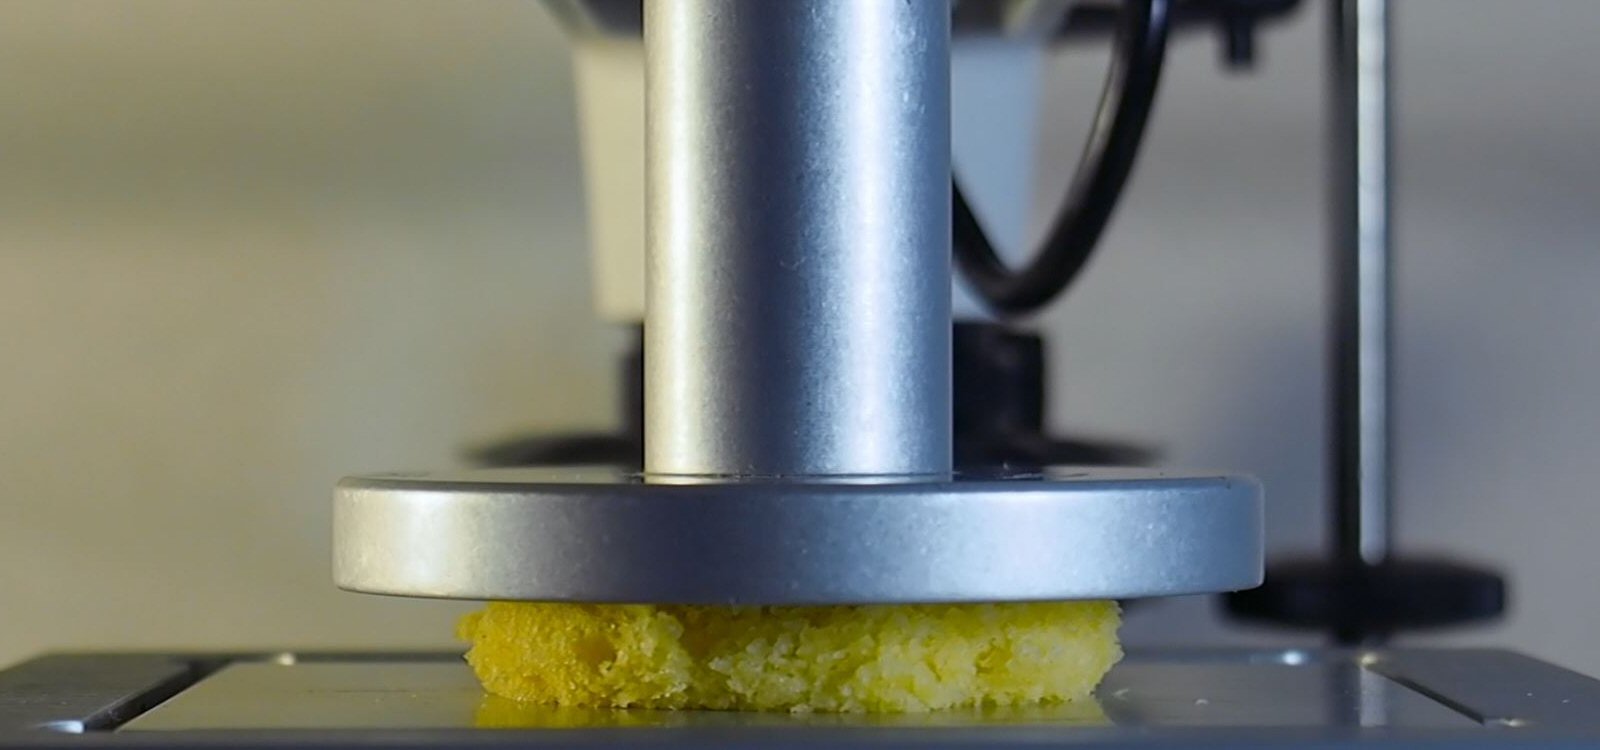
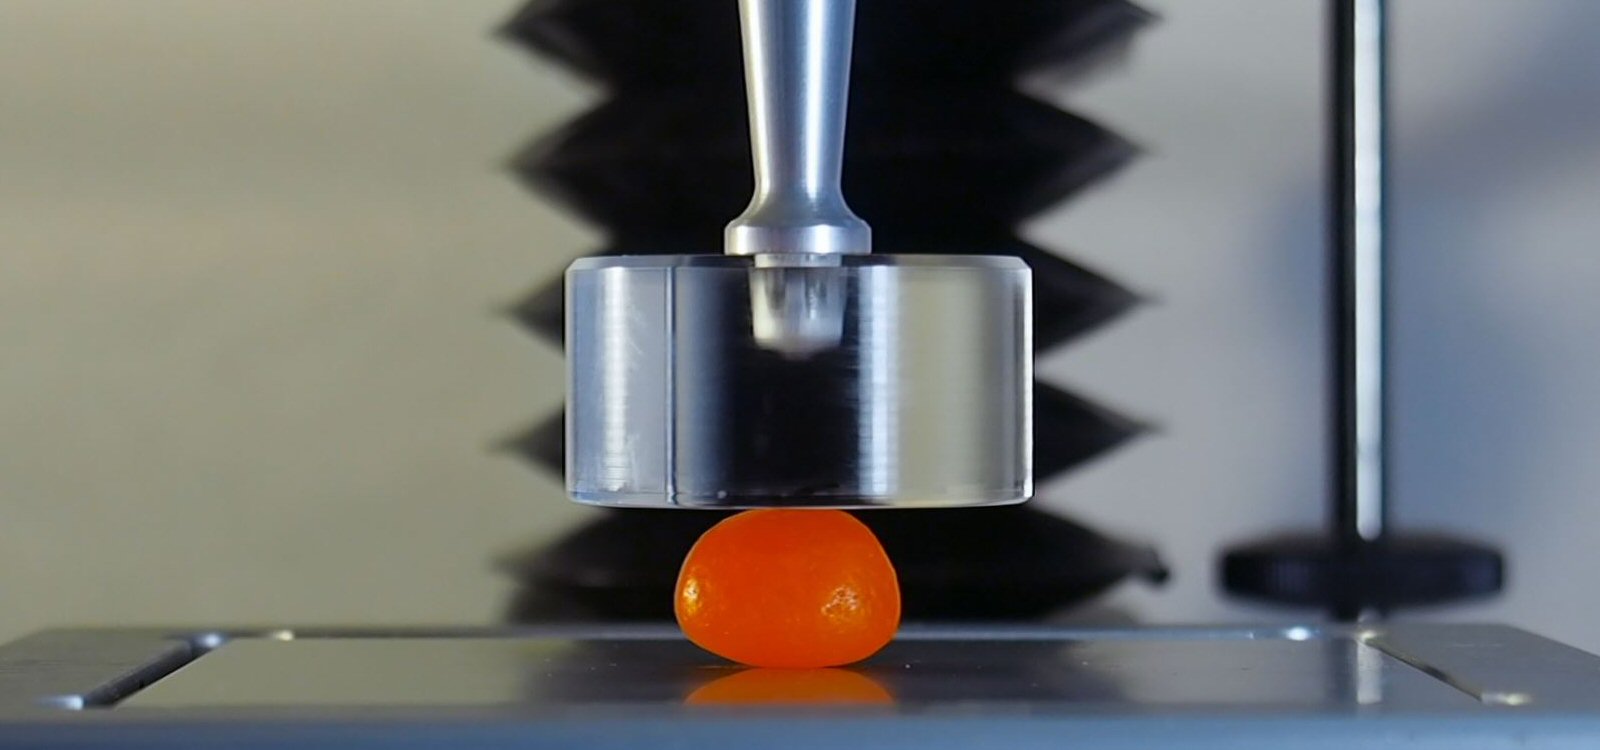
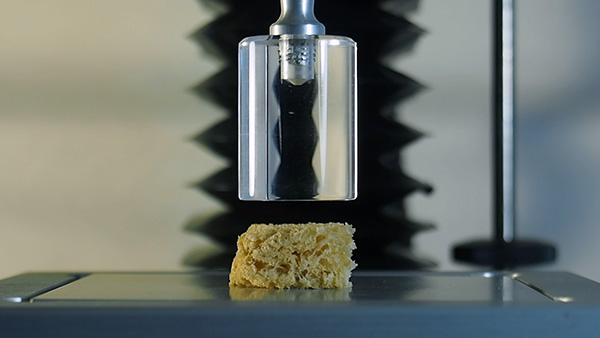
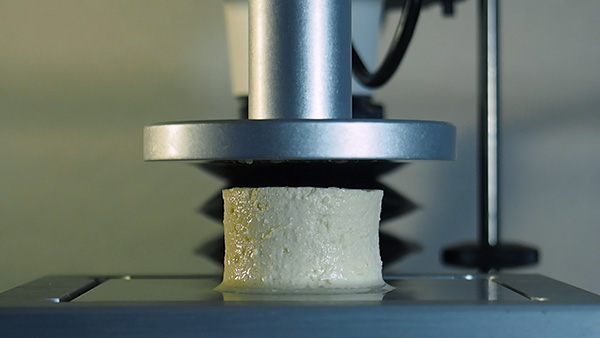
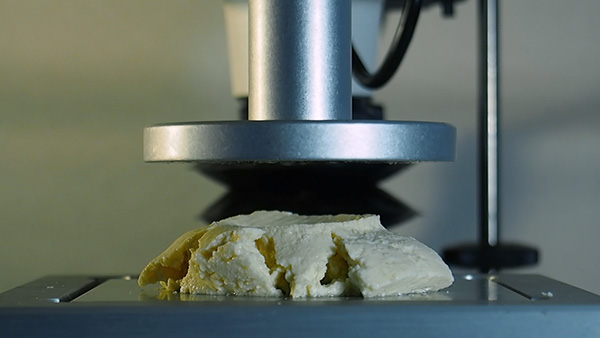
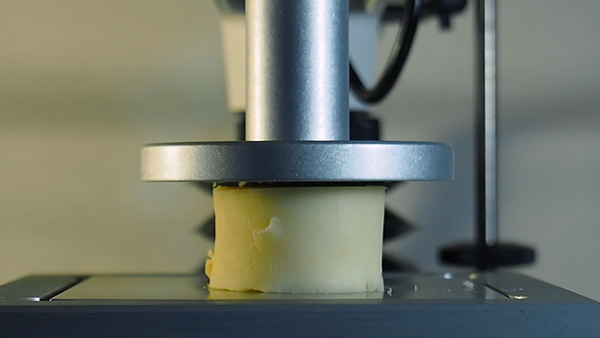
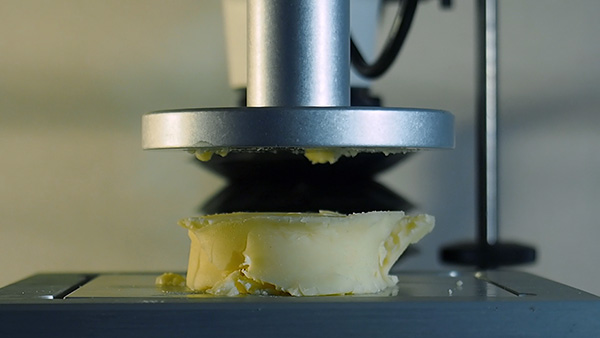
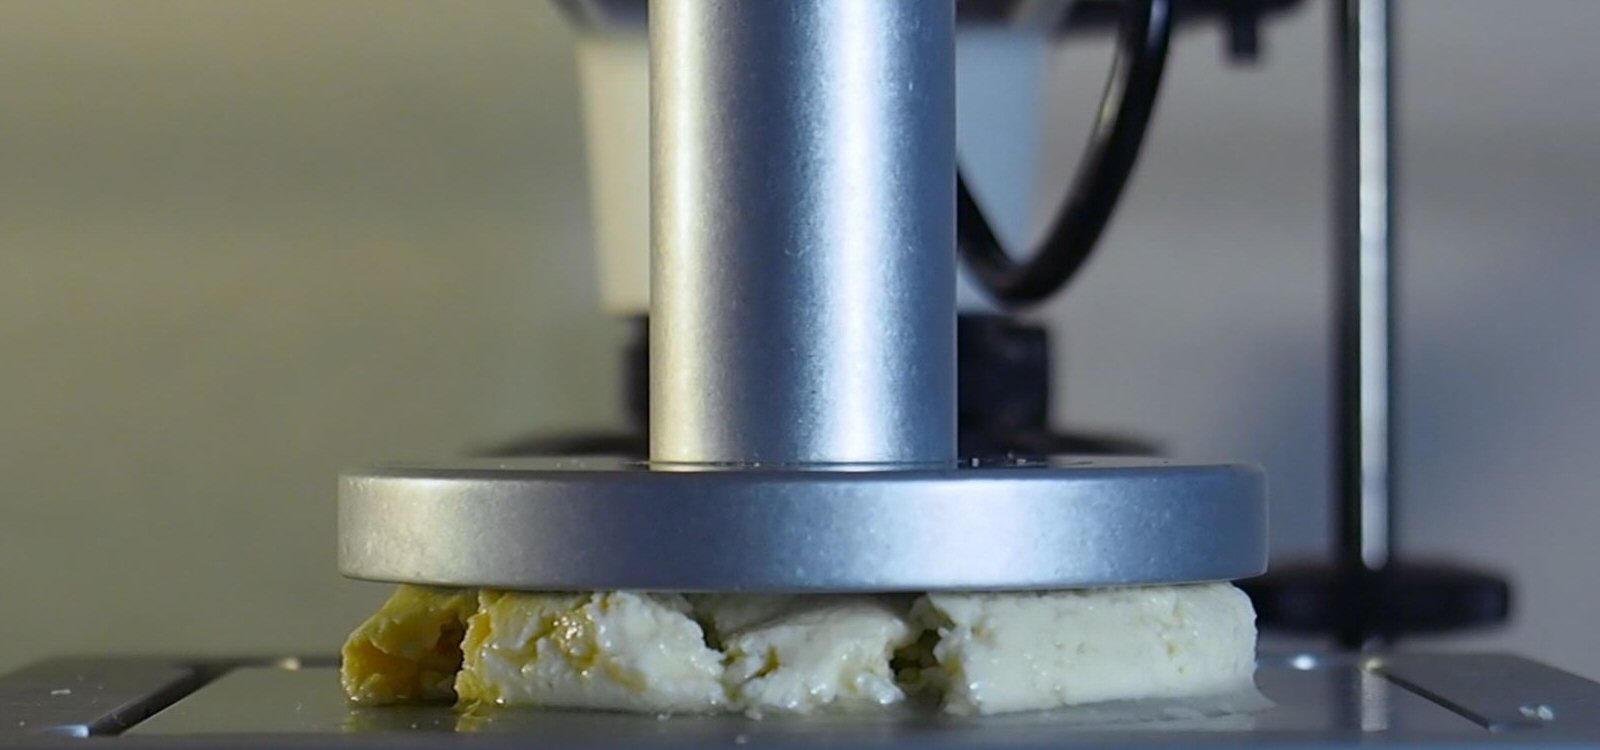
To demonstrate the Texture Profile Analysis test method we conducted tests using a TA.XTPlus Texture Analyzer on seven food products (wheat bread, tofu, cheddar cheese, jelly bean, hot dog, Jello, and pound cake). To see this data, please load this page in desktop view.
We took photographs at the exact same three moments on these seven products during a typical TPA test. The first photo was taken when the probe initially touched the sample at the Automatic Trigger point and illustrates the product's original unstressed condition. The second photo was taken at the bottom of the first compression and illustrates how the product behaved when fully compressed at the target strain. The third photo was taken at the initial contact trigger point but after the second compression has been completed. The position of the product after the second compression cycle illustrates how well the product survived both compression cycles. Obviously, some products are more capable of tolerating moderate stresses than other product. These are the types of behaviors you will see when reviewing published research using the TPA method. In general, many food products can tolerate low stresses but they generally are permanently deformed beyond the point of plastic deformation in strains of greater than 50%.
The same set of photos were also taken for each of three different strains (25%, 50% and 75%) in order to illustrate how the products behave when compressed different amounts.
In addition to the still photos, we have also provided representative test plots and high-definition videos of these products being tested. Note that the videos and still photos were taken of the exact same products in different sessions, so the lighting and zoom profile of the still photos will not precisely match those shown in the video frames. The ARC files were captured simultaneously with the videos.
Following the photos, plots and videos we have presented a table with typical TPA parameter test results.
Product
Initial & Bottom First & Final Photos
Typical Plot
Click to Zoom
High-def Video
Click to Play
Wheat Bread 25%

Wheat Bread 50%

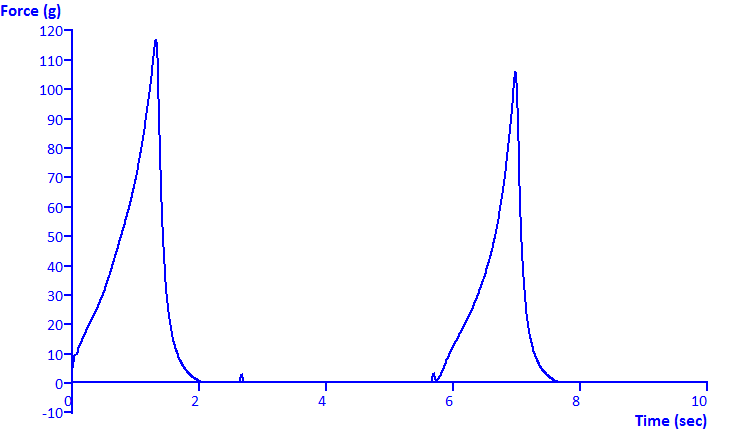
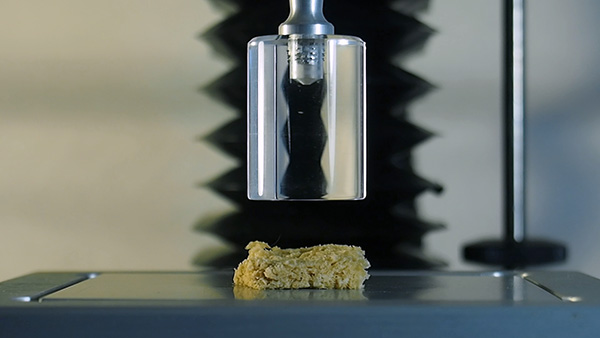
Wheat Bread 75%

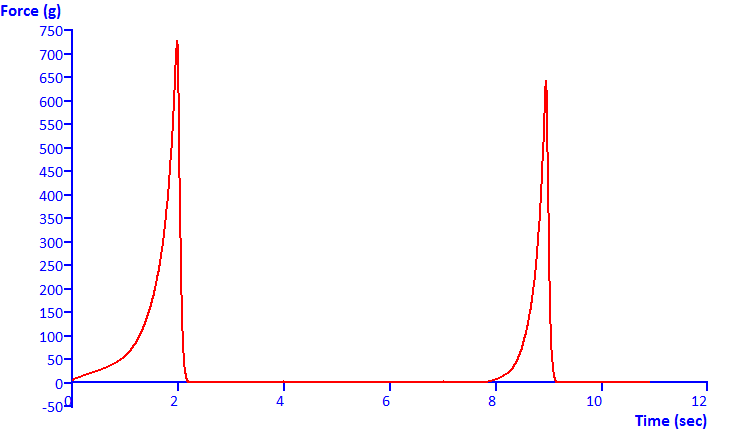
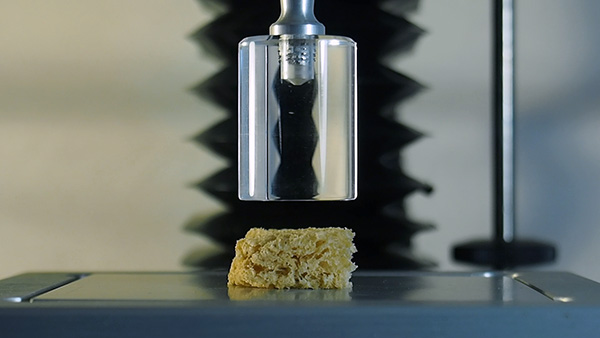
Tofu 25%


Tofu 50%


Tofu 75%


Cheddar 25%


Cheddar 50%


Cheddar 75%


Jelly Bean 25%

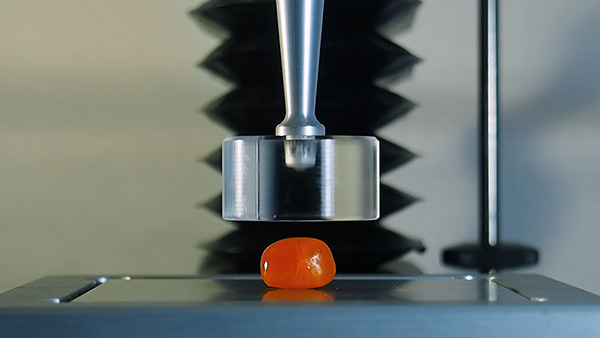
Jelly Bean 50%


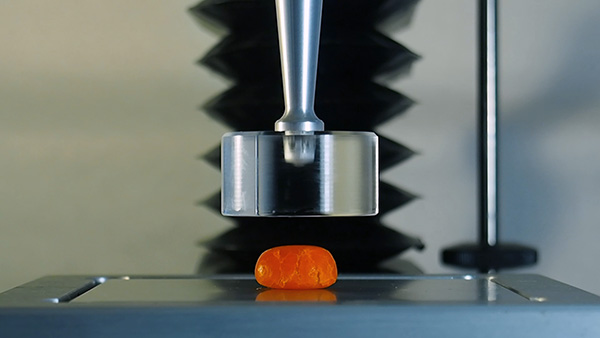
Jelly Bean 75%


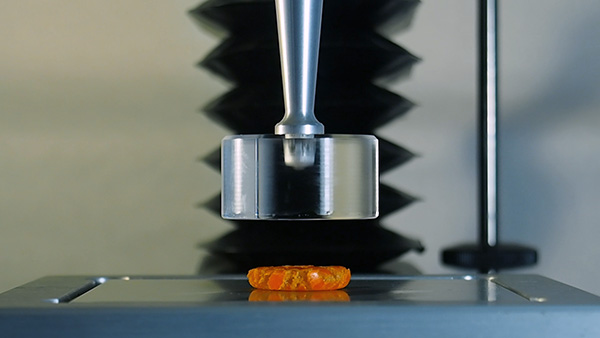
Hotdog 25%


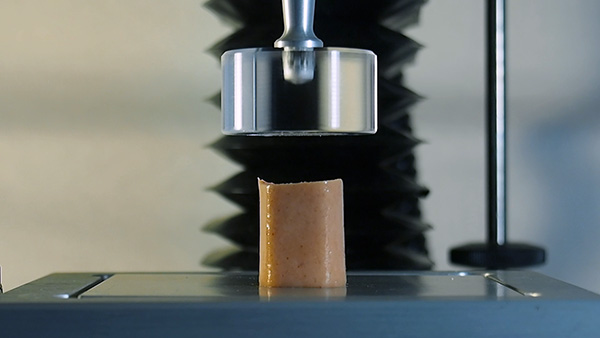
Hotdog 50%


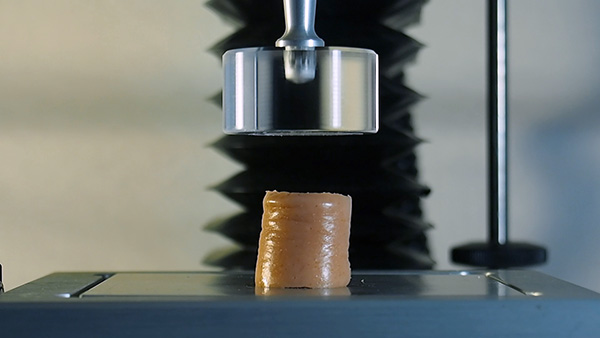
Hotdog 75%


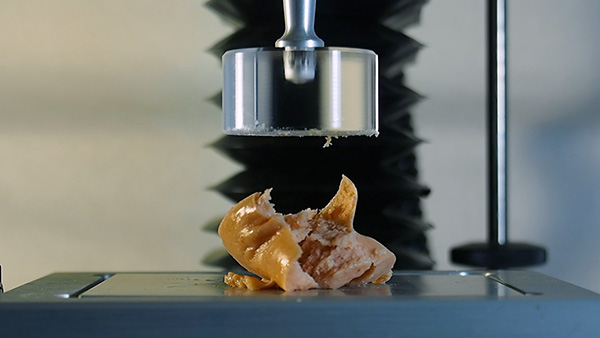
Jello 25%


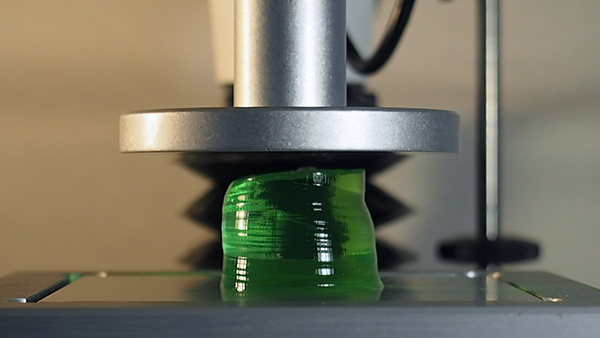
Jello 50%


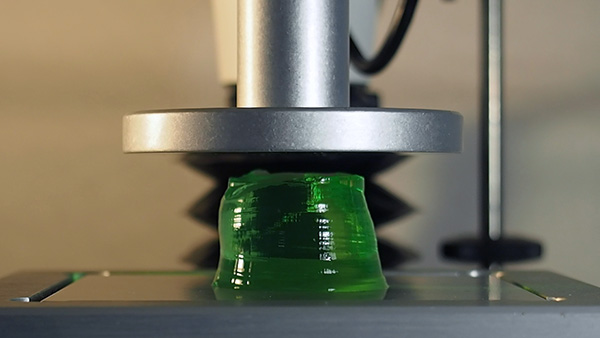
Jello 75%


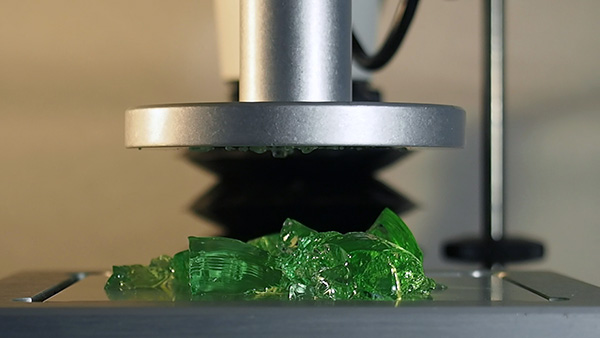
PoundCake 25%


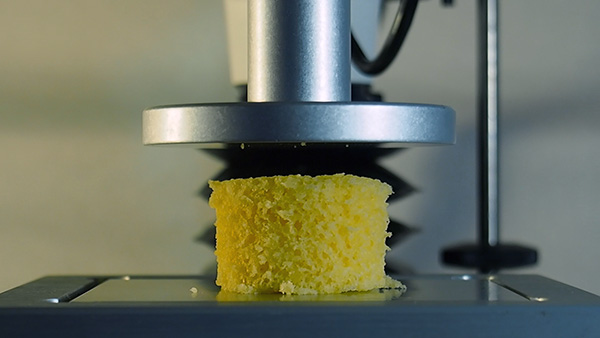
PoundCake 50%


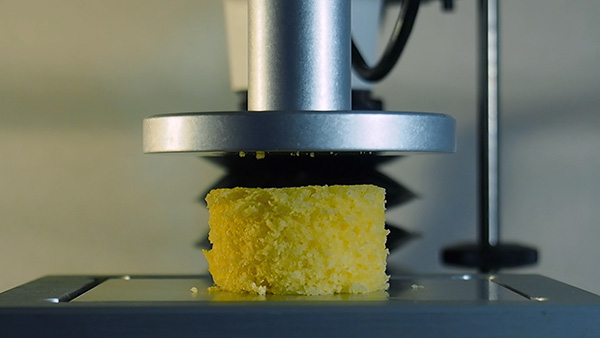
PoundCake 75%


Calculated TPA Results of the Products Above
Primary TPA Parameters
Secondary TPA Parameters
| Hardness (g) | Springiness (%) | Cohesiveness (%) | Resilience (%) | Fracturability (g) | Adhesiveness (g.sec) | Gumminess | Chewiness | |
| Wheat Bread 25% | 38 | 83.6 | 79 | 35.6 | 0 | NA | 25.4 | |
| Wheat Bread 50% | 117 | 85.3 | 72.3 | 25.8 | 0 | NA | 72 | |
| Wheat Bread 75% | 729 | 50.5 | 56.5 | 23.4 | 0 | NA | 208 | |
| Tofu 25% | 1,609 | 99.6 | 89.5 | 52.1 | -5 | NA | 1,434 | |
| Tofu 50% | 3,427 | 91.9 | 50.4 | 20.2 | 3,427 | -12 | NA | 1,587 |
| Tofu 75% | 7,613 | 76.1 | 30.1 | 7 | 2,946 | -1 | NA | 1,742 |
| Cheddar 25% | 34,485 | 84.2 | 64.0 | 26.8 | -265 | NA | 18,563 | |
| Cheddar 50% | 34,528 | 53.7 | 29.1 | 8.3 | 32,093 | -384 | NA | 5,014 |
| Cheddar 75% | 53,087 | 41.3 | 17.4 | 6.3 | 35,078 | -860 | NA | 3,817 |
| Jelly Bean 25% | 2,751 | 78.3 | 43.6 | 11.8 | 0 | NA | 938 | |
| Jelly Bean 50% | 9,043 | 64.5 | 35.6 | 12.0 | 3,414 | -4 | NA | 2,078 |
| Jelly Bean 75% | 27,824 | 26.2 | 29.8 | 14.5 | 2,785 | 0 | NA | 2,165 |
| Hotdog 25% | 1,898 | 94.5 | 75.3 | 37.7 | -10 | NA | 1,350 | |
| Hotdog 50% | 6,095 | 83.9 | 59.6 | 31.0 | -10 | NA | 3,050 | |
| Hotdog 75% | 6,599 | 74.8 | 13.6 | 4.5 | -9 | NA | 671 | |
| Jello 25% | 95 | 88 | 92 | 86.2 | 0 | 87* | NA | |
| Jello 50% | 798 | 96.8 | 90.5 | 78.6 | -11 | 723* | ||
| Jello 75% | 3,937* | 52.5 | 5.3 | 7.3 | 3,937* | -4 | 207* | |
| Pound Cake 25% | 418 | 89.9 | 72.3 | 35.4 | -1 | NA | 272 | |
| Pound Cake 50% | 808 | 88.1 | 54.1 | 19.3 | -2 | NA | 385 | |
| Pound Cake 75% | 4,600 | 74.4 | 38.4 | 10.1 | -21 | NA | 1,314 | |
| *Jello is treated for this analysis as a semi-solid and therefore Gumminess rather than Chewiness values are presented. | ||||||||
| **The analytical macro had to be slightly modified to ensure that the anchors 3,4,6 were properly placed at forces equivalent to the applicable trigger force. | ||||||||
Chapter VII
Examples of TPA Graphs
The following are a few typical TPA plots:
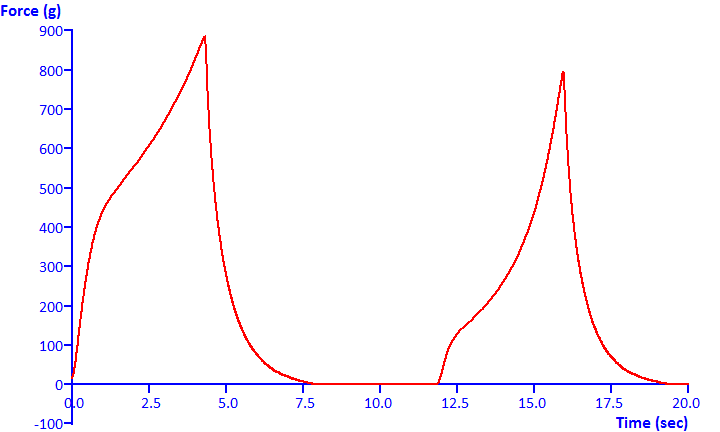
Hard Wheat Bread TPA Classic bread TPA graph on two slices of a very firm wheat bread with a significant yield point as the cells are initially compressed. Note that the second stroke has a substantially lower yield point and the second area of much less than the first compression, indicating moderate cohesiveness.
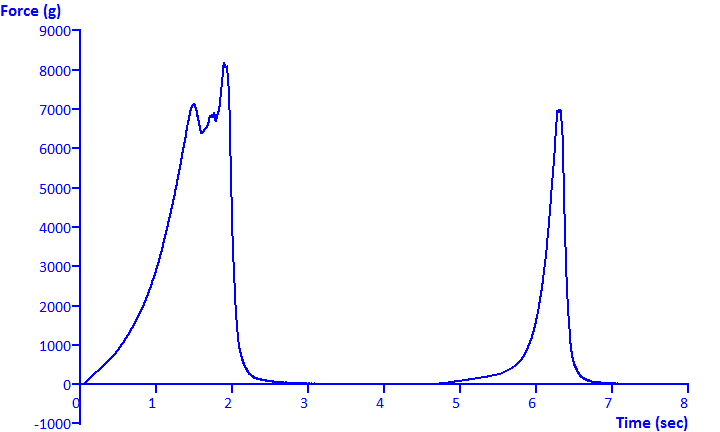
Stiff Hot Dog TPA Classic TPA graph with a mostly single substantial fracture. Note the long tails on the withdrawal and second compression which indicates that the hot dog exhibited far more springiness than it did resilience.
Many products do not exhibit the classic shape TPA curve and users should not be surprised that their plots do not follow the idealized model. Outlined below are graphs which do not follow the standard model, along with a few short annotations.
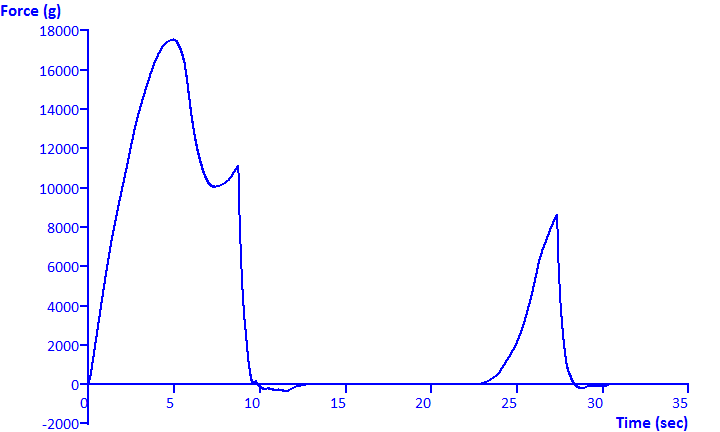
Hard Cheddar Cheese TPA Note that the fracture point is a plastic, not brittle failure and which is the same value is the hardest point on the curve. Thus this curve has a single point which serves as both the Fracturability and the Hardness values.
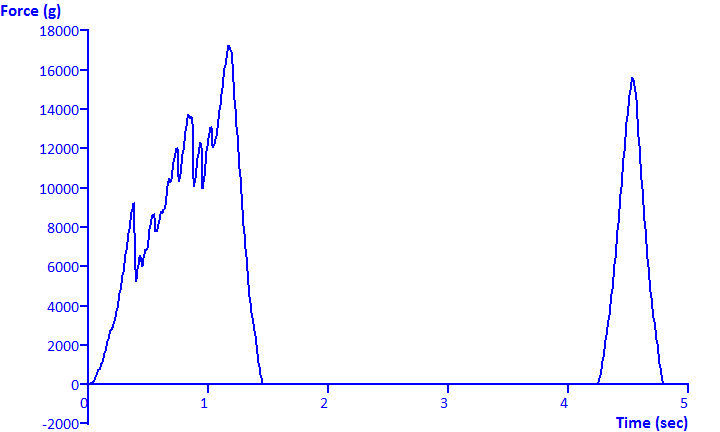
Hard Extruded Product TPA This product fractured many times as it was compressed. The first instance occurred at approximately 9,250 grams and 0.385 seconds (0.959 mm). TPA's single fracture value does not adequately describe the nature of this highly brittle product and its fracture mechanics. The fracture did follow a typical pattern where the hardest point on the curve occurred at the deepest compression. Given its brittle nature (suggesting low moisture content) it is not surprising that the product had no adhesion between the two compressive strokes.
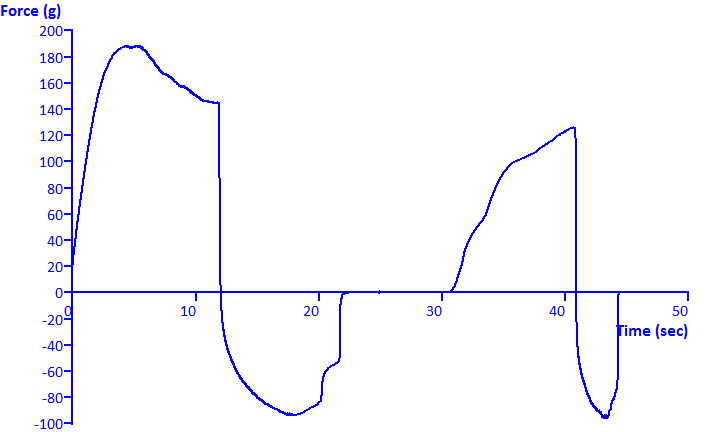
Firm Dough TPA This is a very stiff dough-like product whose fracture/yield is a classic example where the hardness of the product does NOT occur at the deepest compression. Note that the material is extremely adhesive.
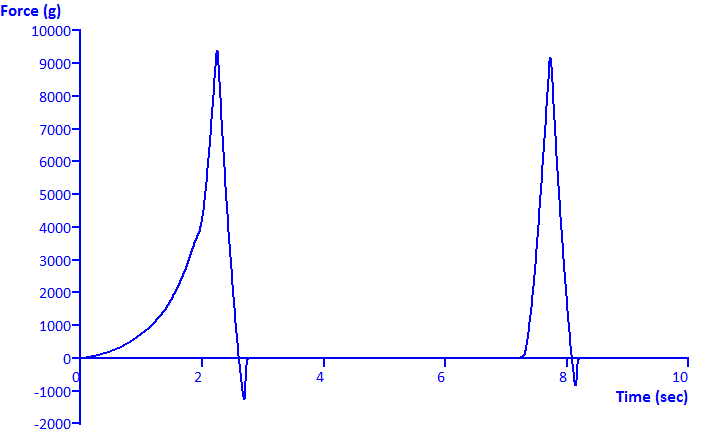
Cooked Pasta TPA Notice how the shape of this force curve is concave, which indicates that the product is being was highly compressed.
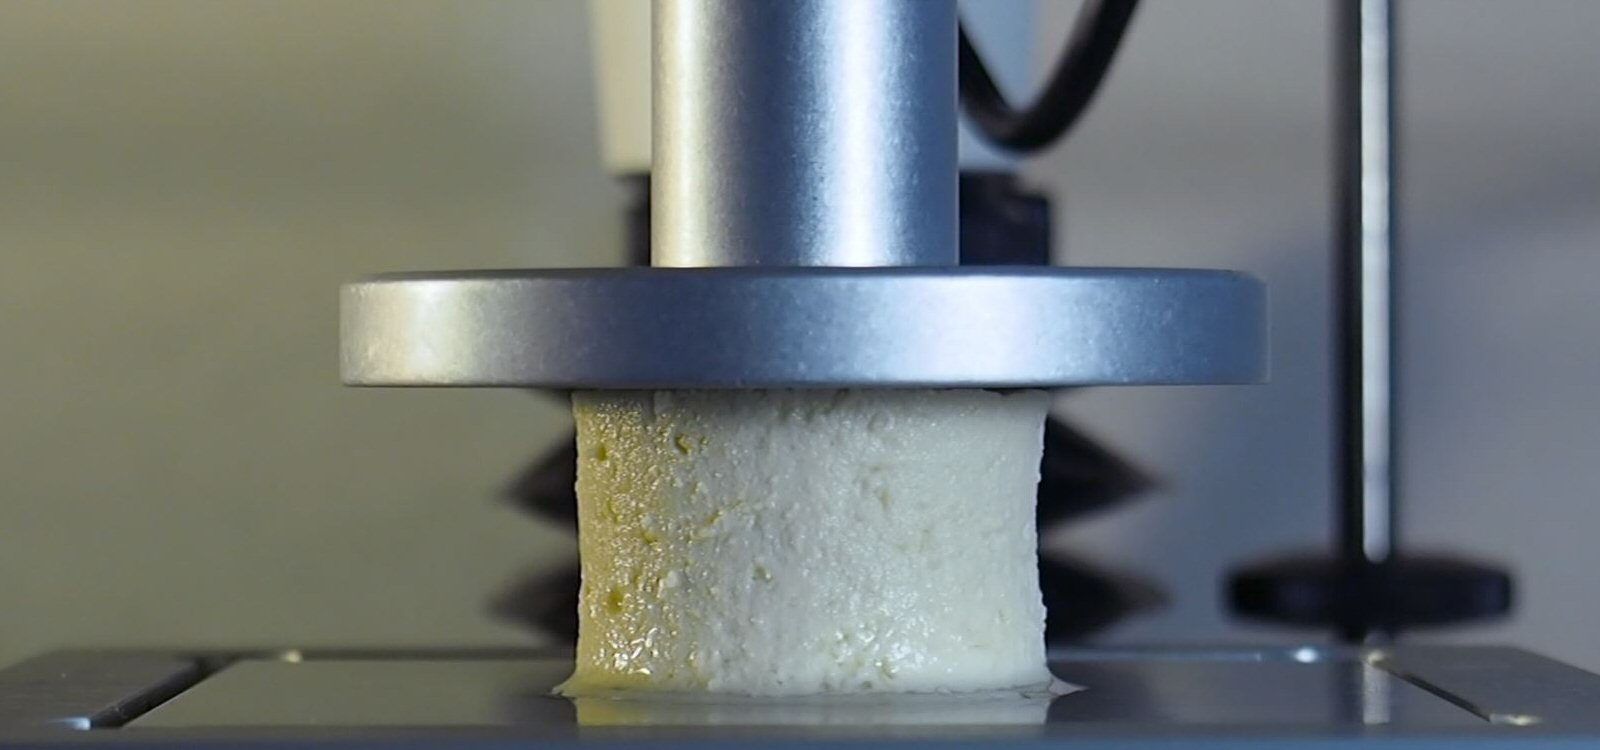
Silicon Gel TPA This hard elastic gel is a typical fully recoverable product with relatively high springiness, cohesiveness and resilience characteristics. Note how the product expands/continues to rebound during the 1 second hold time. This creates an opportunity for the analysis of springiness to be slightly overstated.
Chapter VIII
What are the concerns of using Texture Profile Analysis?
There has been some concern over the use and misuse of TPA. These concerns mainly fall into two categories: misunderstanding/misuse of the original parameters and the use of non-standardized modifications made to the original parameters.
Texture Profile Analysis is an easy test to conduct. William Breene noted in 1975 that the original TPA parameters were often misunderstood which can lead to poor experimental designs and a misuse of how the results are statistically analyzed.Application Of Texture Profile Analysis To Instrumental Food Texture Evaluation, William M. Breene, Journal of Texture Studies, Volume 6, Issue 1, pages 53-82, March 1975 (Scientific Journal Series Paper No. 8743, Minnesota Agricultural Experiment Station, St. Paul, Minn. 55108, U.S.A.). Abstract: Although the Texturometer was used in establishing the GF objective Texture Profile Analysis (TPA) of foods, it has been largely supplanted by the Instron. The Instron GF TPA parameters have been determined for the most part by the original Texturometer procedures. Some workers have chosen to measure only one or several of the GF TPA parameters; others have added new ones. Changes proposed to make parameter names more descriptive have not been universally adopted. Testing conditions (crosshead and chart speed, % deformation, etc.) have varied considerably and have often been poorly described. Multiple point non-GF TPA has been performed on foods using homemade as well as commercial instruments, e.g., Instron, Ottawa Texture Measuring System. Major shortcomings of studies involving TPA include poor experimental design, absence or improper use of statistical analysis and incomplete description of experimental materials and testing conditions. Despite certain shortcomings, TPA (GF or non-GF) via interpretation of stress-strain curves is, and will continue to be, extremely useful in evaluating the textural quality of foods, particularly when parameters can be correlated with sensory assessments.
Another concern is that the TPA parameters are automatically calculated and the easily generated data encourages researchers to simply use the results without considering whether or not the parameters are applicable to the tested product.
Dr. Alina Szczesniak, TPA's founder, cites users with a poor understanding of the parameters and how to apply them as the main concern. As Dr. Szczesniak indicated in her Letter to EditorIssues Pertaining to the Texture Profile Analysis Dr. Alina S. Szczesniak, Letter to the Editor Journal of Texture Studies Vol 29, 1998 (vii-viii). Dr. Szczesniak wrote an excellent letter to the editor discussing the use and misuse of the TPA method. Researchers should be familiar with Dr. Szczesniak's observations: article 1 and article 2. some modifications of TPA are improvements, but also cautioned that some modifications are meaningless. Among them are using penetrating needles instead of compression plates and generating meaningless values by not using common sense. She called out a Journal of Sensory Studies article on Lifesavers in which the candy was shattered at 70% strain so the resulting springiness and chewiness values were without meaning. She observed that common sense would reveal that Lifesavers' hard candies are meant to be sucked, not chewed, so using TPA to calculate chewiness would not yield useful data.
A similar example of misuse would be TPA testing of snack foods like potato chips or taco shells. These snacks would be crushed on the first "bite" leaving no meaningful remaining sample to be tested on the second bite" for Cohesiveness or Springiness. Dr. Szczesniak and Dr. Bourne have stressed that common sense must be used when balancing products' intended uses and determining which parameters are appropriate to measure and evaluate.
Other examples of inappropriately using TPA tests or TPA nomenclature can be found in:
- an AACC 2013 Poster co-authored by Mr. Eric Chiang, Brookfield Engineering's texture Product Manager, with a University of Nebraska student entitled "Improving Nutritional Value of Instant Noodles using Great Northern Bean"Improving nutritional value of instant noodles using Great Northern bean, H. WANG (1), W. S. Ratnayake (1), E. Chiang (2) (1) University of Nebraska-Lincoln; (2) Brookfield Engineering. More information. The test uses a sharply wedge knife blade to conduct a Texture Profile Analysis test and reported springiness values for sheared noodles here. A sheared noodle cannot spring back, so the fundamental nature of TPA was misunderstood by Mr. Chiang.

- a IUFost2014 poster in Montreal, "5-hydroxymethylfurfural: Chemical and Textural Attributes in Dulce de Leche", which used a CT3 to conduct a TPA test on a soft caramel-type product in which values were calculated for cohesiveness, gumminess and chewiness. Obviously, a caramel-type product is not suitably tested with TPA parameters.
- An excellent article in Journal of Cereal Science that used a Kramer Shear Cell to calculate firmness and shear force, but unfortunately also used it to calculate springiness, which, as mentioned above, would not be properly calculated with knife blades.
- Many more articles on the TPA of yogurt than anyone would expect (and a few on peanut butter). While this research may correlate well with consumer sensory judgments, yogurts and peanut butter do not physically exhibit the behavior that is relevant to the standard TPA definitions of cohesiveness, springiness, chewiness and gumminess. These approaches appear to be of broad academic interest and may even produce interesting results that correlate nicely with sensory observations, but they are not TPA results and authors should refrain from labeling the methods as generated with Texture Profile Analysis.
Chapter IX
Conclusion
The TPA method is a powerful tool that can provide highly meaningful insights into product texture. The method respects the fact that the textural identity of any food is both multi-faceted and inherently tied to consumers' sensory expectations. The founders of TPA have embraced thoughtful aspects of how the method has evolved, but they have remained concerned about how frequently the method has been misused or misinterpreted. The beauty of TPA as an analytical method is that it can easily quantify multiple textural parameters, however, researchers should not rely on TPA's labeled characteristics without considering whether the test method provides metrics that are relevant to their experimental objectives. This webpage has been assembled to improve the understanding of TPA so that researchers can properly conduct TPA research and to further advance the TPA toolset.
Stable Micro Systems maintains a page on TPA on their web site and another on their blog. Here are links to those two resources:
Chapter X
Photo Gallery

Dr. Malcolm Bourne with Boine Johnson, Marc Johnson and Louis Petrin at IFT Annual Meeting in 1999

Dr. Alina Szszesniak discussing texture measurement at TTC's IFT Booth in 2003

General Foods Texturometer

Dr. Malcolm Bourne with Randy Koch at TTC's IFT Booth in 2005


Judith Abbott of the USDA testing the texture of tomatoes (photo by Kieth Weller via link from USDA website)
Chapter XI
Additional Resources
- The Texture Profile: Its Foundation and Outlook, H. Moskowitz, J. Kapsalis, Journal of Texture Studies, Vol 6, Issue 1, pp157-166, March 1975.
A brilliant article that summarizes issues tackled by Dr. Szczesniak, Dr. Bourne and others. The authors address balancing the scientific need for sharply defined terms and the more nuanced but important sensory experience. The article observes that standards and scales would to help improve reproducibility; tackles the nature of subjectivity of sensory texture scores and acknowledges the toolset that Texture Profile testing can very useful bringing 'order into chaos'. - Textural profile analysis parameters obtained by an Instron Universal Testing Machine, Micha Peleg, Journal of Food Science, Volume 41:721-722 (1976).
- Food Texture and Viscosity: Concept and Measurement, Second Edition, Malcolm C. Bourne, Academic Press 2002 (1982 1st edition).
- On the Texture Profile Analysis Test, Khanh Tuoc Trinh and Steve Glasgow, Institute of Food Nutrition and Human Health, Massey University.
A review of TPA that was presented at the Chemeca 2012 Conference in Australia. - Texture Profile Method, Brandt, Margaret A., Skinner, Elaine Z., and Coleman, J. A.: 1963, , J. Food Sci. 28, 404.
- A Classification of Objective Methods for Measuring Texture and Consistency of Foods, M. C. BOURNE, Journal of Food Science, Volume 31, Issue 6, pages 1011-1015, November 1966.
Abstract: The numerous methods for objectively measuring the textural properties of foods are classified on the basis of the variable or variables that are the basis of measurement. Physical methods of measurement are classified under the headings force-measuring, distance-measuring, time-measuring, energy-measuring, ratio-measuring, multiple-measuring, and multiple-variable instruments. There are also some chemical methods for measuring texture objectively. Methods that do not fit into any of the above categories make a special, miscellaneous group. Examples are given of the kinds of instruments found in each category. - Measure of Shear and Compression Components of Puncture Tests, M. C. Bourne, Journal of Food Science, Volume 31, Issue 2, pages 282-291, March-April 1966.
Abstract: A study was designed to separate and measure the compression components (proportional to area) and the shear components (proportional to perimeter) of a simple puncture test. Two sets of punches were used (one with a constant area and a variable perimeter, and the other with a constant perimeter and a variable area) to measure the compression and shear components in puncture tests on foam plastic board and representative foods. The puncture force for both can be expressed by the equation F = K,P + K,A + C, where K., K, and C are constants, P is the perimeter of the punch, and A is the area of the punch. K, represents the shear coefficient and Kc the compression coefficient of the food being tested. For a given punch, F depends upon K, and K, which are properties of the material being tested. For a given material, F depends on the perimeter and area of the punch. These results can be used as a basis for design of punch shape and size in a practical puncture test. The shear component of a puncture test can be increased or decreased relative to the compression component by manipulating the perimeter/ area ratio of the punch. - Objective Measurements For Texture In Foods, Essex E. Finney, Journal of Texture Studies, Volume 1, Issue 1, pages 19-37, November 1969.
Abstract: Foods are complex systems exhibiting various degrees of elasticity, viscosity, and plasticity. Because of its complex structure and mechanical behavior, objective measurements of food texture may be influenced by a variety of test conditions, including rate of loading, the magnitude of deformations imposed upon the material, geometry of the loading surface, and localized yielding within the product tested. These sources of variance are discussed. Brief descriptions are given of methods for measuring texture of meats, dairy products, bakery foods, fresh fruits and vegetables, and processed commodities. The paper concludes with a discussion of new techniques for assessing textural qualities of foods based upon an analysis of sound, light transmission, and vibration phenomena. - Modernization Of Texture Instrumentation, Peter W. Voisey, Journal of Texture Studies, Volume 2, Issue 2, pages 129-195, May 1971.
Abstract: The use of electronic instruments to record force and deformation in objective texture measurements is reviewed to point out that much equipment is available for that purpose and to indicate some of the problems associated with its use. Electronic transducers are universally applicable to texture measuring systems and can give precise measurements with a high degree of resolution. Several examples of modernized texture instruments are described to demonstrate different methods of approach. Special purpose or 'universal units' can be developed. It is concluded that force and deformation can be recorded by electronic techniques in any textural test but that the interpretation of the data is the major problem. - Structure and Textural Properties of Foods, Sherman, P.: 1972, Food Technol. 26, 69.
- Texture Measurement Of Individual Cooked Dry Beans By The Puncture Test, Malcolm C. Bourne, Journal of Food Science, Volume 37, Issue 5, pages 751-753, September 1972.
Abstract: The Instron Universal Testing Machine was set up to puncture test a large number of cooked dry beans, one bean at a time, by using the distance cycling controls on the machine. The punch is caused to cycle between two preset distance limits at a predetermined speed, permitting the operator to devote full attention to placing and removing beans in the puncture cup. 10 beans per minute can be conveniently tested by this procedure. The number of peak force heights in 20 selected force ranges are counted off from the chart, making for rapid retrieval of data. Tests on cooked dry beans show that the number of beans in each texture range follows approximately a normal distribution pattern, except for the presence of a few exceptionally hard beans which cause the distribution curve to tail off into the high puncture-force range. - General Foods Texturometer Application to Food Texture Research in Japan, Tanaka M., 1975, Journal Of Texture Studies: 101-116.
- Relationship Between Sensory And Instrumental Texture Profile Attributes Jean-Francois Meullenet, B.G. Lyon, John A. Carpenter, C.E. Lyon, Journal of Sensory Studies, Volume 13 (1998). 77-93.
Abstract: Texture relationships were studied using both sensory and instrumental texture profile analysis (TPA) techniques to evaluate twenty-one food samples from a wide variety of foods. High linear correlations were found between sensory and instrumental TPA parameters for hardness (r = 0.76) and springiness (r = 0.83). No significant correlations were found between sensory and instrumental TPA parameters for cohesiveness and chewiness. Logarithmic transformations of data improved correlations between sensory attributes and their instrumental corollaries. The correlation between sensory hardness and the logarithm of instrumental hardness was improved to r = 0.96. The correlation between the logarithm of both sensory and instrumental springiness was improved to r = 0.86. The correlation between the logarithms of both sensory and instrumental chewiness was improved to r = 0.54, which was significant at P<0.05. - Texture Profile Analysis - How Important Are The Parameters? Andrew J. Rosenthal Journal of Texture Studies 41 (2010) 672-684 .
- Dr. Malcolm Bourne, Emeritus Professor Food Science at Cornell University, gave an outstanding presentation "Genesis and Evolution of Food Texture Perception and Measurement" at the IFT2014 in New Orleans at the symposium: "Pioneering Technologies for a Deeper Understanding of Food Texture, Perception, and Consumer Behavior." The well-attended session was moderated by Dr. Dulce Paredes of Takasago International and was an excellent look back and look forward on issues relating to texture measurement. Dr. Bourne's presentation was a detailed overview of texture measurement and of the people who put in place the foundations that we all work with on a daily basis.
- Texture Profile Method, Brandt, Margaret A., Skinner, Elaine Z., and Coleman, J. A.: 1963, , J. Food Sci. 28, 404.
- A Classification of Objective Methods for Measuring Texture and Consistency of Foods, M. C. BOURNE, Journal of Food Science, Volume 31, Issue 6, pages 1011-1015, November 1966.
Abstract: The numerous methods for objectively measuring the textural properties of foods are classified on the basis of the variable or variables that are the basis of measurement. Physical methods of measurement are classified under the headings force-measuring, distance-measuring, time-measuring, energy-measuring, ratio-measuring, multiple-measuring, and multiple-variable instruments. There are also some chemical methods for measuring texture objectively. Methods that do not fit into any of the above categories make a special, miscellaneous group. Examples are given of the kinds of instruments found in each category. - Measure of Shear and Compression Components of Puncture Tests, M. C. Bourne, Journal of Food Science, Volume 31, Issue 2, pages 282-291, March-April 1966.
Abstract: A study was designed to separate and measure the compression components (proportional to area) and the shear components (proportional to perimeter) of a simple puncture test. Two sets of punches were used (one with a constant area and a variable perimeter, and the other with a constant perimeter and a variable area) to measure the compression and shear components in puncture tests on foam plastic board and representative foods. The puncture force for both can be expressed by the equation F = K,P + K,A + C, where K., K, and C are constants, P is the perimeter of the punch, and A is the area of the punch. K, represents the shear coefficient and Kc the compression coefficient of the food being tested. For a given punch, F depends upon K, and K, which are properties of the material being tested. For a given material, F depends on the perimeter and area of the punch. These results can be used as a basis for design of punch shape and size in a practical puncture test. The shear component of a puncture test can be increased or decreased relative to the compression component by manipulating the perimeter/ area ratio of the punch. - Objective Measurements For Texture In Foods, Essex E. Finney, Journal of Texture Studies, Volume 1, Issue 1, pages 19-37, November 1969.
Abstract: Foods are complex systems exhibiting various degrees of elasticity, viscosity, and plasticity. Because of its complex structure and mechanical behavior, objective measurements of food texture may be influenced by a variety of test conditions, including rate of loading, the magnitude of deformations imposed upon the material, geometry of the loading surface, and localized yielding within the product tested. These sources of variance are discussed. Brief descriptions are given of methods for measuring texture of meats, dairy products, bakery foods, fresh fruits and vegetables, and processed commodities. The paper concludes with a discussion of new techniques for assessing textural qualities of foods based upon an analysis of sound, light transmission, and vibration phenomena. - Modernization Of Texture Instrumentation, Peter W. Voisey, Journal of Texture Studies, Volume 2, Issue 2, pages 129-195, May 1971.
Abstract: The use of electronic instruments to record force and deformation in objective texture measurements is reviewed to point out that much equipment is available for that purpose and to indicate some of the problems associated with its use. Electronic transducers are universally applicable to texture measuring systems and can give precise measurements with a high degree of resolution. Several examples of modernized texture instruments are described to demonstrate different methods of approach. Special purpose or 'universal units' can be developed. It is concluded that force and deformation can be recorded by electronic techniques in any textural test but that the interpretation of the data is the major problem. - Structure and Textural Properties of Foods, Sherman, P.: 1972, Food Technol. 26, 69.
- Texture Measurement Of Individual Cooked Dry Beans By The Puncture Test, Malcolm C. Bourne, Journal of Food Science, Volume 37, Issue 5, pages 751-753, September 1972.
Abstract: The Instron Universal Testing Machine was set up to puncture test a large number of cooked dry beans, one bean at a time, by using the distance cycling controls on the machine. The punch is caused to cycle between two preset distance limits at a predetermined speed, permitting the operator to devote full attention to placing and removing beans in the puncture cup. 10 beans per minute can be conveniently tested by this procedure. The number of peak force heights in 20 selected force ranges are counted off from the chart, making for rapid retrieval of data. Tests on cooked dry beans show that the number of beans in each texture range follows approximately a normal distribution pattern, except for the presence of a few exceptionally hard beans which cause the distribution curve to tail off into the high puncture-force range. - General Foods Texturometer Application to Food Texture Research in Japan, Tanaka M., 1975, Journal Of Texture Studies: 101-116.
- The Texture Profile: Its Foundation and Outlook, H. Moskowitz, J. Kapsalis, Journal of Texture Studies, Vol 6, Issue 1, pp157-166, March 1975.
This brilliant article sums up the issues tackled by Dr. Szczesniak, Dr. Bourne and others. The authors address the importance of balanceing the scientific need for sharply defined terms and the more nuanced but important sensory experience. The article observes that standards and scales would to help improve reproducibility; tackles the nature of subjectivity of sensory texture scores and acknowledges the toolset that Texture Profile testing can very useful bringing 'order into chaos'. - Textural profile analysis parameters obtained by an Instron Universal Testing Machine, Micha Peleg, Journal of Food Science, Volume 41:721-722 (1976).
- Food Texture and Viscosity: Concept and Measurement, Second Edition, Malcolm C. Bourne, Academic Press 2002 (1982 1st edition). Note that TPA descriptions are on pages 182-186.
Abstract: Drawing together literature from a variety of fields, Food Texture and Viscosity, 2E, includes a brief history of this area and its basic principles. It reviews how texture and viscosity are measured, including the physical interactions between the human body and food, objective methods of texture measurements, the latest advances in texture-measuring instruments, various types of liquid flow, and more. This revised edition contains approximately 30% new material, including two new chapters on physics and texture and the correlation between physical measurements and sensory assessments. It now includes two-color illustrations and includes a current list of equipment suppliers. - Relationship Between Sensory And Instrumental Texture Profile Attributes Jean-Francois Meullenet, B.G. Lyon, John A. Carpenter, C.E. Lyon, Journal of Sensory Studies, Volume 13 (1998), 77-93.
Abstract: Texture relationships were studied using both sensory and instrumental texture profile analysis (TPA) techniques to evaluate twenty-one food samples from a wide variety of foods. High linear correlations were found between sensory and instrumental TPA parameters for hardness (r = 0.76) and springiness (r = 0.83). No significant correlations were found between sensory and instrumental TPA parameters for cohesiveness and chewiness. Logarithmic transformations of data improved correlations between sensory attributes and their instrumental corollaries. The correlation between sensory hardness and the logarithm of instrumental hardness was improved to r = 0.96. The correlation between the logarithm of both sensory and instrumental springiness was improved to r = 0.86. The correlation between the logarithms of both sensory and instrumental chewiness was improved to r = 0.54, which was significant at P<0.05. - Texture Profile Analysis - How Important Are The Parameters? Andrew J. Rosenthal Journal of Texture Studies 41 (2010) 672-684.
- On the Texture Profile Analysis Test, Khanh Tuoc Trinh and Steve Glasgow, Institute of Food Nutrition and Human Health, Massey University.
This paper is a very nicely written review of TPA that was presented at the Chemeca 2012 Conference in Australia.
Abstract: The texture profile analysis or TPA has been widely used for food products characterization and quality control since it was invented by the General Foods Corporation Technical Centre in 1963. However not all the textural parameters defined in the original test are correct and useful. In addition, the results can be very misleading if the test is not conducted with the proper operational settings. This paper describes a number of key considerations for a successful textural analysis. - Dr. Malcolm Bourne, Emeritus Professor Food Science at Cornell University, gave an outstanding presentation "Genesis and Evolution of Food Texture Perception and Measurement" at the IFT2014 in New Orleans at the symposium: "Pioneering Technologies for a Deeper Understanding of Food Texture, Perception, and Consumer Behavior." The well-attended session was moderated by Dr. Dulce Paredes of Takasago International and was an excellent look back and look forward on issues relating to texture measurement. Dr. Bourne's presentation was a detailed overview of texture measurement and of the people who put in place the foundations that we all work with on a daily basis.
Published December 2015; Modified October 2023
This work can be cited using MLA format as: Johnson, Marc. “Overview of Texture Profile Analysis.” December 2015, Modified October 2023. Texture Technologies Corporation Web Site. Web. ((Date Accessed)). https://www.texturetechnologies.com/resources/texture-profile-analysis>
In this guide, you will learn about the physical characteristics your Texture Analyzer can measure.
If you have questions or want information specific to your product, don't hesitate to talk to one of our specialists .

